

In this report, our third note in this new post-COVID world in which we find ourselves, we take a step back to consider where we are in the cycle and where we see the need to adjust our forecasts, including our GDP and earnings estimates as well as forward-looking expected investment returns. We also detail how these inputs have helped us to deploy capital across a variety of products and geographies. To date, the lion’s share of our activity has centered on three areas: divestitures, secular growers, and refinancing good companies with sub-optimal capital structures. In each instance we are working hard as a firm to get the macro theme correct, deliver operational improvement at the company level, and embrace capital structures that are both flexible and durable. We have also been spending a lot of time on portfolio construction. As part of this process, we have been working closely with our investment teams and clients to have conviction surrounding key issues that have become top of mind, including a better understanding of the health of the U.S. consumer, the global outlook for the virus, and overall financial conditions. Our bottom line: While the savings rate has exploded higher, structural impairments to the economy, combined with high unemployment levels and a concerning rise in active COVID cases in multiple U.S. states, suggest to us that we will see a square root-shaped recovery, rather than a V-shaped one, as we head into 2021.
“ Forces beyond your control can take away everything you possess except one thing, your freedom to choose how you will respond to the situation. ”
The above quote strikes a chord. Without question, the coronavirus has certainly introduced ‘forces beyond [our] control’. Indeed, beyond the tragic aspects of the disease, the pandemic has also adversely affected so many lives in ways that were previously unimaginable. Yet, despite the coronavirus’ unsavory impact on society, we have been impressed by the overall resiliency of the human spirit ‘to respond to the situation.’ Healthcare first responders, in particular, have distinguished themselves at a time of surging cases across cities, regions, and countries.
Throughout our global offices we too have focused on ‘responding to the situation’ at hand through resiliency — resiliency as we partner with our companies to help them operate safely, resiliency in being a positive force in our communities, and resiliency as it relates to our supporting clients and fellow employees journeying alongside us in this new, largely virtual world where we now find ourselves. We have also focused on better educating ourselves and having difficult conversations around the agonizing racial events that have occurred, listening to our valued colleagues/clients’ pain, anger and raw emotions from the deep wounds and injustices that for many remain unhealed and unaddressed.
Amidst all the uncertainty and angst, we have also continued to focus our minds on our fiduciary role as investors. In particular, we have worked hard to find creative ways to put capital to work on behalf of our limited partners (LPs). All told, since February, we have deployed — on a gross basis — nearly $31 billion across a variety of sectors, including Private Equity, Infrastructure, Real Estate, and Credit, and across regions, including Asia, Europe, and the Americas. Each transaction is different, but the lion’s share of our activity has been focused around three areas: divestitures, secular growers, and refinancing good companies with sub-optimal capital structures. In each instance we are trying to do three things well: 1) leverage proprietary thematic work that embeds strong macro tailwinds when deploying capital; 2) focus on value creation at the company-level (i.e., via repositioning the company, growth organically, through acquisitions, operational enhancement, or with management upgrades); and 3) create capital structures with flexibility to withstand uncertain times.
As part of our portfolio construction process during this heightened period of deployment, we have been working closely with our colleagues and clients to tackle key issues that have become top of mind. The main topics we have been researching of late really break down into four buckets and include the following:
- Continuing the approach of our last publication, we have updated our thinking around global economic growth. See below for details, but we have boosted our U.S. Real GDP forecast for 2020 to -6.5% from -9.0% as the initial bump from re-opening has been impressive. In fact, data for May — personal income, payrolls, and retail sales — and parts of June, including housing, paints a vigorous recovery picture. Meanwhile, in Europe we lift our forecast marginally to -9.3% from -9.9%, while our China forecast goes to 1.7% from 1.6% previously. Those estimates all reflect good news on improved growth trends. The bad news is that, after a convincing jump in activity, our forecasting models will soon turn towards a slower rebound in growth of jobs and business momentum on a relative basis. Indeed, just consider that the U.S. has already recouped two-thirds of the nine million jobs we have been forecasting to be added by the end of 2020. Some of the slowdown is related to tougher sequential comparisons, while other inputs are being adversely impacted by COVID cases rising again, a trend we expect to persist into the fall. Hence, we maintain our view that the economic rebound will ultimately be more of a square root recovery than the sustained V-shaped one many are now proclaiming.
- In terms of themes, we remain quite bullish about several key trends, including nesting/home improvement, domestic travel, digitalization, and e-commerce. However, we are increasingly constructive that this downturn will lead to an emphasis on personal well-being, not just financial safety (which typically emerges as a key trend during slowing economic growth). Indeed, consumers are not deferring big-ticket items this cycle; rather, reliable transportation and adequate housing are leading to a surge in spending related to a new theme: personal safety. The personal safety theme also extends into healthcare resiliency, transportation resiliency, and technology resiliency, and it is likely to be funded by both consumer savings and government transfers.
- We have also updated our equity valuation model, which moves slightly higher on the heels of somewhat stronger GDP and EPS estimates (Exhibit 18). However, as mentioned earlier, that growth rate falls in 2021, and as such, we are less concerned about the market running away from us here. See below for full details, but we now see fair value around 3,020–3,120. On the Credit side, we have updated our thinking as well. As we discuss later in the note, our implied default monitor is now at 7.5%, down substantially from around 15% in March of 2020, but up from 5.9% in May and a long-term historical average of 6.1%. At current levels, we agree we are pretty close to fair value.
- Meanwhile, we have received multiple questions about our interest rate forecast and the potential for inflation to surprise on the upside. As we detail below, we are still in the disinflation camp near-term (remember we have been consistently highlighting that central bank liquidity has not led to an increase in the money multiplier), but we are warming up to the idea that this time could be different in the out years. Key to a potential change in our thinking is that the fiscal response has been so large that it could ultimately create demand inflation at a time when supply chains are being redistributed. Indeed, similar to how politicians now use Twitter to bypass the traditional media, we are finding that central banks and politicians — compliments of low rates, better technology, and heightened political ambitions — are increasingly bypassing traditional lending institutions to deposit money directly into the hands of their voter base. If the virus passes more quickly than we are envisioning and unemployment snaps back, this backdrop could create an environment where demand exceeds supply. Government subsidies/transfers could also be misdirected into short-term consumables that do not boost long-term productivity the way that investments in infrastructure, healthcare, and education often do. Finally, there is also the potential of Yield Curve Control (YCC), which we discuss below in more detail as it relates to the potential for rising inflation expectations.
- Probably the biggest area of focus for many with whom we speak is what does all this mean for asset allocation? See below for details, but we think that the current backdrop is decidedly bullish for the following asset classes: Global Infrastructure, International Private Equity, Opportunistic Liquid Credit, Gold, Logistics/Warehouses, and Asset-Based Finance in areas such as Housing. On the other hand, because of their low yields, we believe that Government Bonds can no longer fulfill their traditional role as a true diversifier and income producer, and that the traditional 60/40 asset allocation mix will not deliver anywhere near the same returns that it did in the past 10 years (Exhibit 45). As such, allocators will need to be much more creative — and potentially aggressive — in their approach to generate their required returns.
Overall, the message we laid out in Phase II: The Next Chapter remains the same. Specifically, we are focused on 1) financing good companies that may want to shore up their capital structures; and/or 2) partnering with secular cash flow compounders that embody the macro themes we champion as a Firm. Importantly, it’s not enough to simply get the theme or the company right. Rather, as mentioned earlier, we must drive value creation at the enterprise level as well as champion capital structures that provide our portfolio companies with enough flexibility to weather what could be a bumpy recovery period.
Looking ahead, the key risk is not whether we will have a recovery. Given all the stimulus and the magnitude of the recent decline in GDP growth, simple arithmetic confirms that sequential comparisons will look really compelling in the near-term. Also, the savings rate has exploded higher, which will provide consumer spending with firepower in the coming months. However, as noted earlier, given some of the more structural impairments to the economy that we are envisioning — largely compliments of accelerated trends towards digitalization — we see more of a square root recovery than a V-shaped one as we head into 2021. Indeed, consistent with the higher levels of structural unemployment that we are forecasting, we believe that shifting consumer behavior patterns around e-commerce, work from home, and travel will likely all have longer-term implications for the sustainable rate of economic growth. There are other forces to consider as well. Specifically, history suggests that the ‘visible hand’ of government intervention (i.e., monetary and fiscal stimulus), which now totals 44% of GDP in the United States, is usually followed with heightened oversight, including increased regulation, taxes, and financial repression.
Given these crosscurrents, we firmly believe that the best approach to private market portfolio management is to operate, as we describe in more detail below, with a top-down overlay that reinforces steady deployment, limits concentration risks, and reduces unintended correlations over the long-term. In doing so, we enter the second half of 2020 confident that our top-down framework can continue to help our LPs compound capital at an above average rate — something others with a near-term focus on profits might miss during a period of uncertainty that we think could last longer than the consensus now believes. As Winston Churchill famously reminded the British people in 1942 from London’s Mansion House, “Now this is not the end. It is not even the beginning of the end. But it is, perhaps, the end of the beginning.”
EXHIBIT 1
Across Multiple Counties in the United States, Trends in New Coronavirus Cases Are Not Encouraging for Those Betting on a V-Shaped Recovery
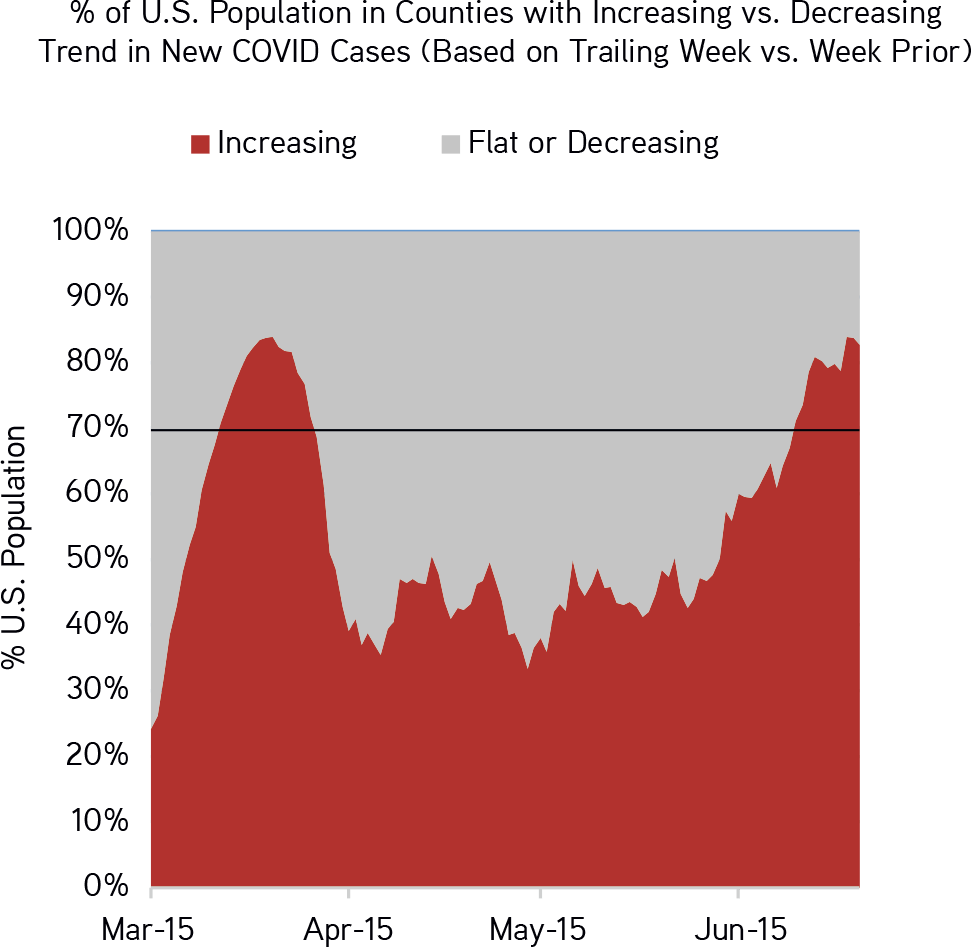
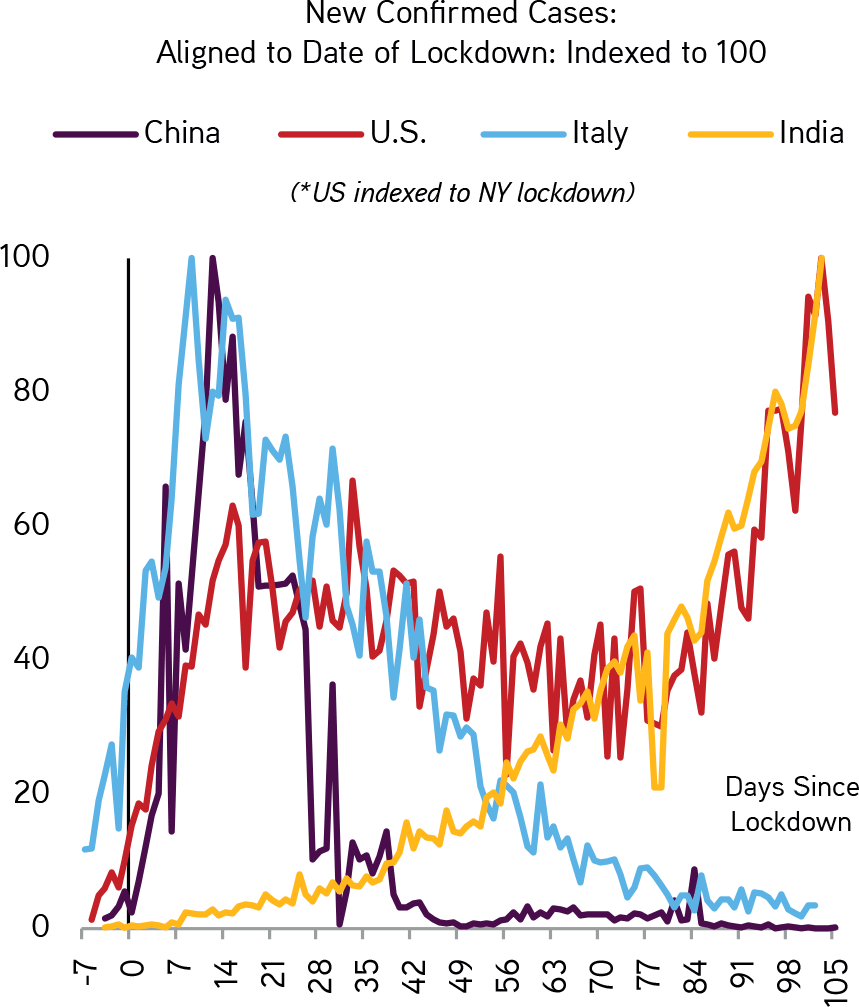
EXHIBIT 2
Global Cases Are Bifurcating by Country, a Trend We Expect to Continue
SECTION II: DETAILS
Question #1: How are you thinking about GDP growth, earnings, and valuation?
Similar to our recent notes of April and May, we wanted to dedicate part of this report to outlining what has changed in our thinking. For starters, our 2020 forecast for Europe moves to -9.3% from -9.9% previously. Key to this outlook is that unlike in previous crises, this time European authorities have responded quickly and powerfully to support the economy. Indeed, based on our numbers, the ECB is likely to increase the size of its balance sheet from 40% of GDP before COVID struck, to closer to 70% of GDP by the end of 2021 — a truly staggering move. Fiscal authorities have been equally active, and it is not just at a national level. At the EU-level, a proposal for a 750 billion euros ‘Next Generation EU’ fund is currently under discussion. Notably, the proposal includes a large, 500 billion euros component of grants that do not have to be repaid. Importantly, as this process unfolds, we are about to see large, coordinated fiscal transfers from stronger to weaker economies in Europe, which is an exciting development relative to the EU’s history.
Meanwhile, in China Frances Lim now looks for Real GDP of 1.7% in 2020, followed by growth of 7.6% in 2021. Frances boosted her GDP growth forecast to reflect better than expected housing starts and infrastructure spending as well as consumer spending. High frequency data confirms that the recovery in China remains uneven at best with a swift recovery in manufacturing and construction while retail sales, though better than expected, remains tepid.
EXHIBIT 3
Many Parts of the Chinese Economy Have Rebounded of Late

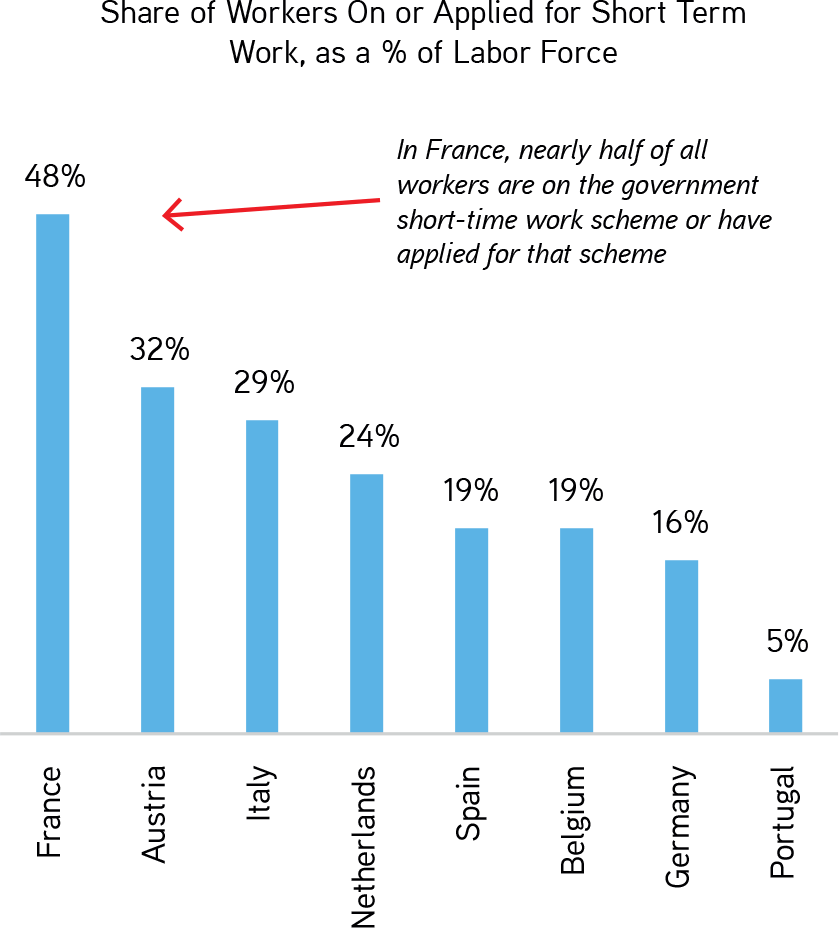
EXHIBIT 4
In Europe, There Have Been Truly Incredible Levels of State Intervention to Support the Economies
Unlike the more modest tweaks we are making in Europe and China, we are substantially raising our forecast for growth in the U.S. Specifically, we have boosted our U.S. Real GDP forecast to -6.5% from -9.0%. However, the rebound we look for in 2021 becomes a more modest 4.5% versus 5.5% previously. Our latest estimates for 2020 remain below consensus, which currently stands at -5.7%. We acknowledge the potential for further upside to our forecast, but we have intentionally maintained a relatively conservative stance. We believe this provides a margin of safety to the liquidity assumptions we embed in macro-sensitive underwritings, particularly given our view that U.S. COVID-19 case flow could remain elevated in coming months.
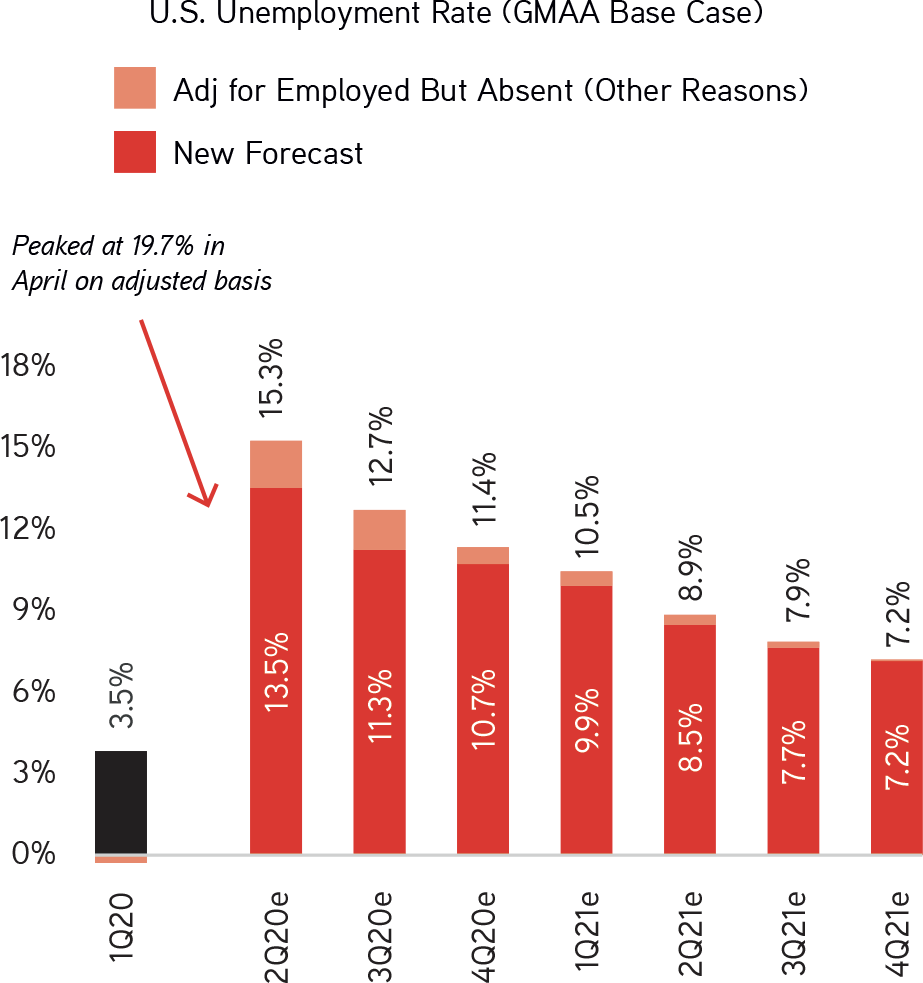
In terms of key inputs to our U.S. forecast, we want to highlight that our new estimates now include a view of idled workers being under-counted by government estimates. In actuality, we expect unemployment to remain above 10% through year-end 2020, and to fall to around seven percent by year-end 2021. Adjusting for a spike in workers who are ‘employed but absent from work,’ we estimate the unemployment rate actually peaked at 19.7%, five percentage points above the official government estimate of 14.7%. Looking ahead, the Bureau of Labor Statistics plans to correct these distortions; however, in the interim (Exhibit 6) we show our estimates for how the official and actual unemployment rates will evolve in coming quarters.
EXHIBIT 5
Our New Forecasts Remain Below Consensus and Assume U.S. GDP Does Not Reach Pre-COVID Levels Until the End 2021/Early 2022

EXHIBIT 6
Adjusting for Undercounted Job Absence, Unemployment Remains Above 15%
As we show in Exhibit 10, real time activity trackers have been hooking up since mid-April. A key part of this has been government transfers. In fact, when we drill down on the increase in income from February to May, it is almost entirely linked to robust government assistance, which has increased by a whopping 61% since February. One can see this in Exhibit 11. This increase is hugely important because it is occurring when 18 million or more Americans are seeking unemployment benefits. In fact, ‘true’ employee compensation over the same period actually declined by 8.3% and proprietors’ income by an even steeper 17.4%. The extent of the ‘jaws’ between income (up) and spending (down) maxed out in April, then contracted a bit in May, but still remained very wide by historic standards.
EXHIBIT 7
For 2020, Our Global Forecasts Are More Conservative Than the Consensus
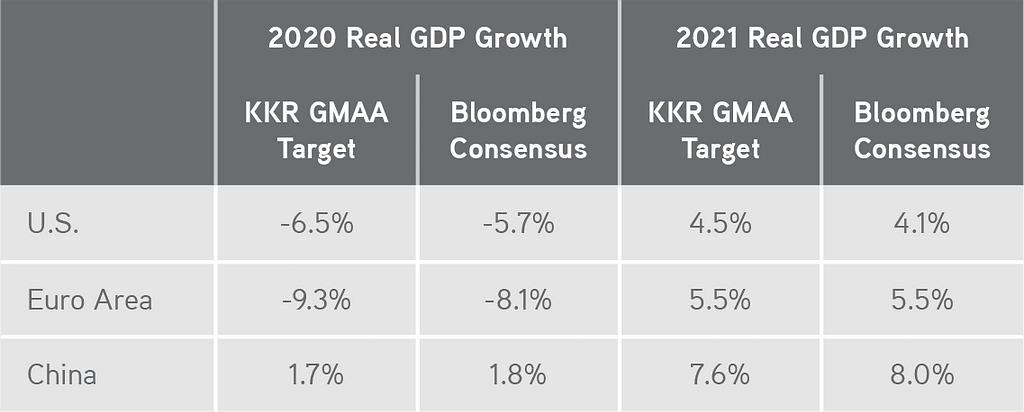
GDP = Gross Domestic Product. Bloomberg consensus estimates as at June 28, 2020. Source: KKR Global Macro & Asset Allocation analysis.
EXHIBIT 8
Near-Term Economic Trends Are Quite Constructive. However, We Ultimately See More of a Square-Root Recovery Than a Traditional V-Shaped One

GDP = Gross Domestic Product. Bloomberg consensus estimates as at June 12, 2020. Source: KKR Global Macro & Asset Allocation analysis.
While incomes increased in May versus February, household outlays declined by a substantial 11.6%. When digging deeper into what changed between February and May, many categories of goods spending have been stable (e.g., vehicle spending is roughly flat), but spending on services has been heavily disrupted based on the declines to recreation (-56%), restaurants (-42%), transportation (-40%), and health care (-24%).
EXHIBIT 9
Personal Income Is Rising Because of Government Programs, Which Are Boosting Savings at a Time of Slower Spending. This Backdrop Is Creating Important Firepower for Consumer Purchases in 2H20, Despite Ongoing Unemployment Headwinds in the U.S.

EXHIBIT 10
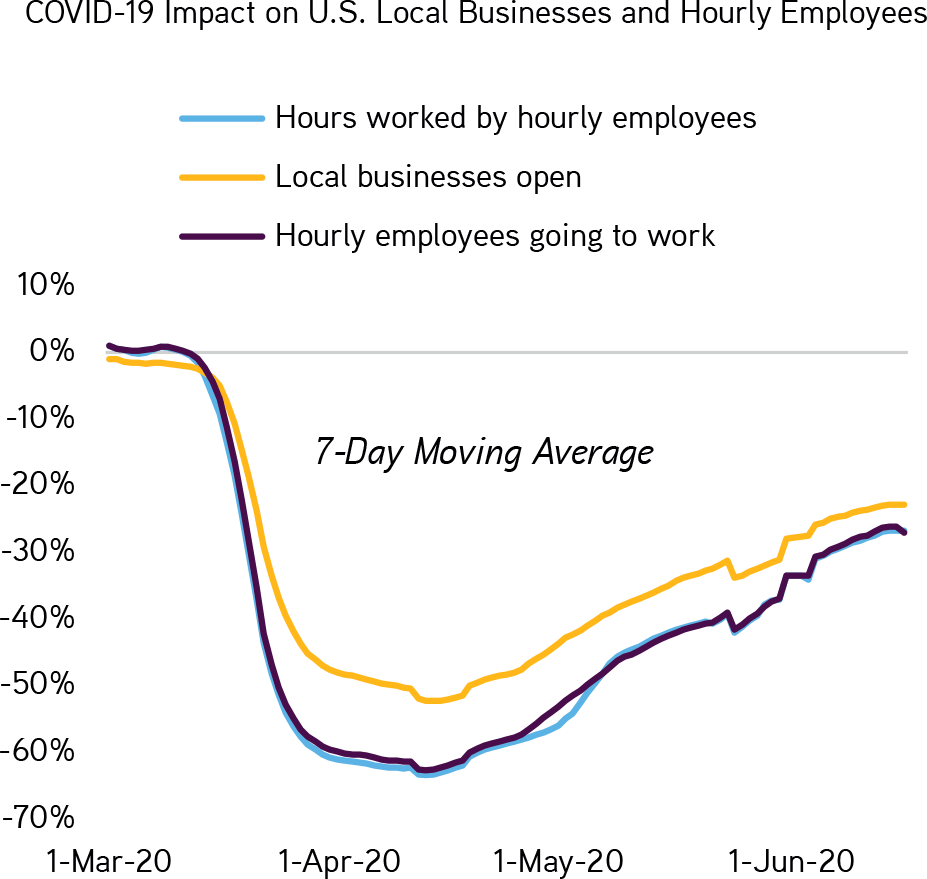
Hours Worked in the United States Is Now ‘Only’ 20–30% Below Pre-Coronavirus Levels. However, the Rate of Change Is Now Beginning to Slow

EXHIBIT 11
U.S. Household Disposable Incomes Have Actually Risen During Coronavirus, Thanks to Massive Government Transfers
Netting the income increases and spending declines described above, the U.S. personal savings rate reached 23% in May 2020 versus eight percent in February 2020. While the savings rate has already started to fall from a historic peak of 32% in April, it still represents a substantial level of consumer firepower to support the recovery. Indeed, in absolute dollars, May’s total savings was a solid $4.1 trillion (annualized), compared to $1.4 trillion in the month of February (annualized). As such, assuming continued government assistance (which we view as highly likely, albeit perhaps at different levels), we see the future trajectory of the recovery being governed much more by the virus than by economics (i.e., consumers’ ability to spend rather than their willingness).
The other piece of good news relates to consumer confidence around the purchase of bigger ticket items this cycle relative to past downturns. Specifically, we are seeing surprising resilience in big-ticket categories such as housing and autos, as consumers focus on personal safety. The typical response in a recession is to prioritize ‘financial safety’, which means deferring large-scale purchases such as housing and autos. This cycle, however, consumers seem less focused on financial safety (perceiving to some extent that the government has their backs) and more focused on ‘personal safety.’ Reliable transportation and adequate housing are important elements of personal safety, which we think helps explain the surprising resilience we are seeing in home prices — suburban in particular — and used car values. The strength in these traditionally cyclical areas is an important support to overall consumption patterns.
EXHIBIT 12
Auto-Related Data Improved Substantially in May, Including Used Car Prices. However, Trends Are Now Slowing a Bit
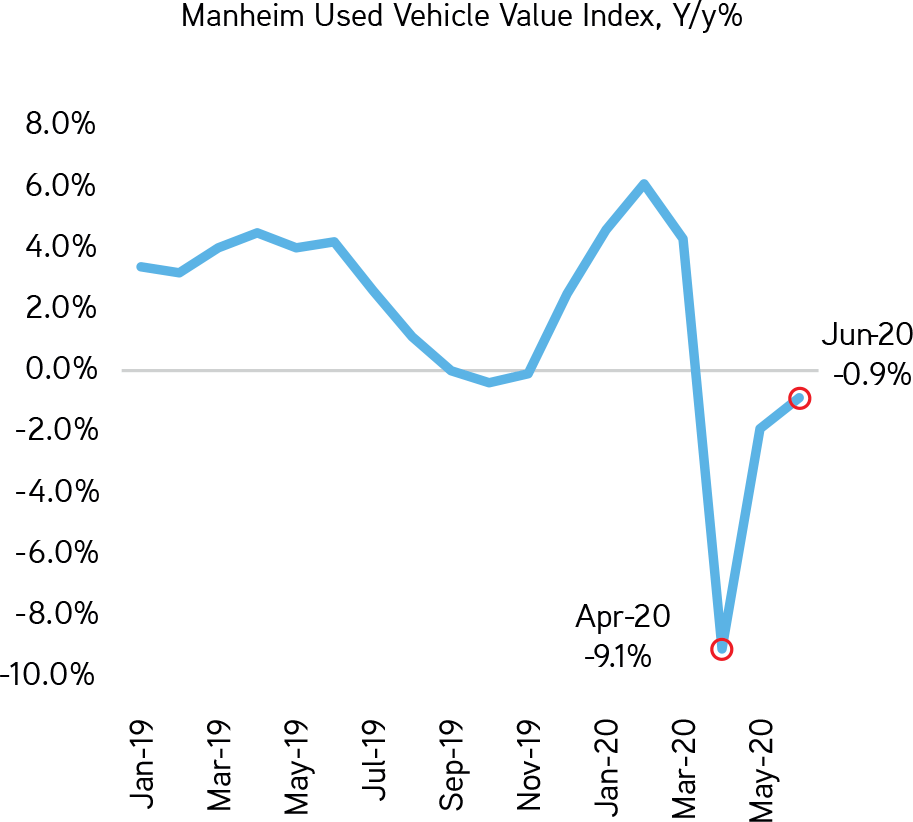
EXHIBIT 13
We Saw a Burst of Work Resumptions from Mid-April Through Mid-May, but Since Then the Rate of Improvement Has Started Slowing

The bad news, as we noted earlier, is that the latest data is looking consistent with a ‘square root’ shaped recovery (i.e., an initial impressive jump, followed by more gradual improvement). Indeed, trends in employees working and credit card spending both show an impressive surge in activity from mid-April through Memorial Day. However, since then the rate of improvement has slowed. This slowing pace of improvement makes sense to us, given that active case counts remain elevated (particularly outside of New York, the original epicenter) and the initial sugar high from stimulus checks may be slowing. We also continue to worry that much of the U.S. has opened up too quickly and without adequate safeguards regarding social distancing, mask wearing and contact tracing, in some cases. Federal and state leaders have also been inconsistent in their messaging and behavior. Just consider that Texas now has more cases per day than all of continental Europe. It actually takes about four weeks to show whether social distancing patterns are effective, and as such, we link much of the recent uptick in Florida, Arizona, and California to intensification of social activity during the early weeks of the summer. Finally, as our employment and household data show, U.S. consumers in several important parts of the economy are being hard hit by the pandemic (Exhibits 9 and 10).
EXHIBIT 14
We Expect Services, Which Led the Decline, to Lead the Way Back Up

EXHIBIT 15
Of All Business Closures On Yelp Since March 1, 41% Are Now Permanent

In sum, we expect the recovery to continue, albeit at a more modest sequential growth rate starting in the fall. Even with a vaccine (which we think enters the economic picture in 2021), there will be fits and starts along the way. Hence, our strong view is that it is important for investors to get two things right. First, developing a better understanding of consumer behavior is critical. Our research shows that government transfers are bolstering savings and spending at an unsustainable pace, and as such, we expect some moderation of growth in the second half of 2020. That said, our research convincingly shows that consumers have saved substantially, and we do not see the type of fall-off in spending that many bearish pundits are forecasting.
Second — and probably more importantly — much of our prior work on portfolio construction from the 2008/2009 period actually shows that getting the investment theme right combined with an in-depth understanding of the consumer largely trumped valuation considerations. Said differently, understanding how consumers might spend in 2022 and beyond is likely a better use of time than arguing over whether the entry multiple should be higher or lower by one turn of leverage. Given this view, we continue to focus on marrying the macro with the micro, including investing aggressively behind the aforementioned themes. If we follow this playbook, then we will be well-positioned to 1) compound the capital that is performing; and 2) minimize losses so that our impairments are lower this cycle than in the past.
Question #2: How does your increase in GDP affect your thinking on equity market valuations?
Given our changes to GDP, we have again updated our S&P 500 EPS and fair value estimates based on the latest GDP estimates. To review, back in April we forecasted that 2020 EPS would be down almost 40% year-over-year to $101 per share, driven by the view that the coronavirus would create multiple fits and starts in the economy throughout the year. Thereafter, we previously expected that easier comparisons, better medical options, and a greater understanding of how best to operate in pandemic-like conditions would drive S&P 500’s earnings to rebound to $151 per share in 2021. Importantly, just as the market capitalization of the S&P 500 is dominated by only a handful of stocks, so too are its earnings. So, we continue to spend extra time on the companies we view as needle movers (Exhibit 16).
EXHIBIT 16
For the S&P 500 This Year, the Top 10 Stocks Account for Nearly 25% While the Top 20 Are Nearly at 40% of Total Earnings

EXHIBIT 17
The S&P 500 Has Enjoyed the Fastest Market Rally of All Time in the 71 Trading Days Since the Bottom. The Chart Below Shows What This Rally Would Look Like If It Were on Par With the Mega Bounces of 1929, 1938, and 1974

Given all that has happened (including the potential for more stimulus), we are now tweaking those April estimates up slightly to reflect our improved GDP forecasts. In terms of what has changed, we note the following:
- We are revising our S&P 500 EPS estimate to $115 per share in 2020 and $155 per share in 2021, up from $101 per share and $151 per share, respectively. However, our numbers remain more conservative than current consensus, which is expecting $125 per share in 2020 and $164 per share in 2021.
- In terms of sectors, we have moderated the EPS declines for Technology, Healthcare, Consumer Discretionary and Financials relative to our April update to reflect both improving earnings revisions trends and better-than-expected 1Q20 earnings. Relative to consensus, however, we are more conservative in our outlook for Financials, Real Estate, Technology, and Materials.
EXHIBIT 18
We Are Revising Up Both Our 2020 and 2021 EPS Estimates to $115 per Share and $155 per Share, Respectively…
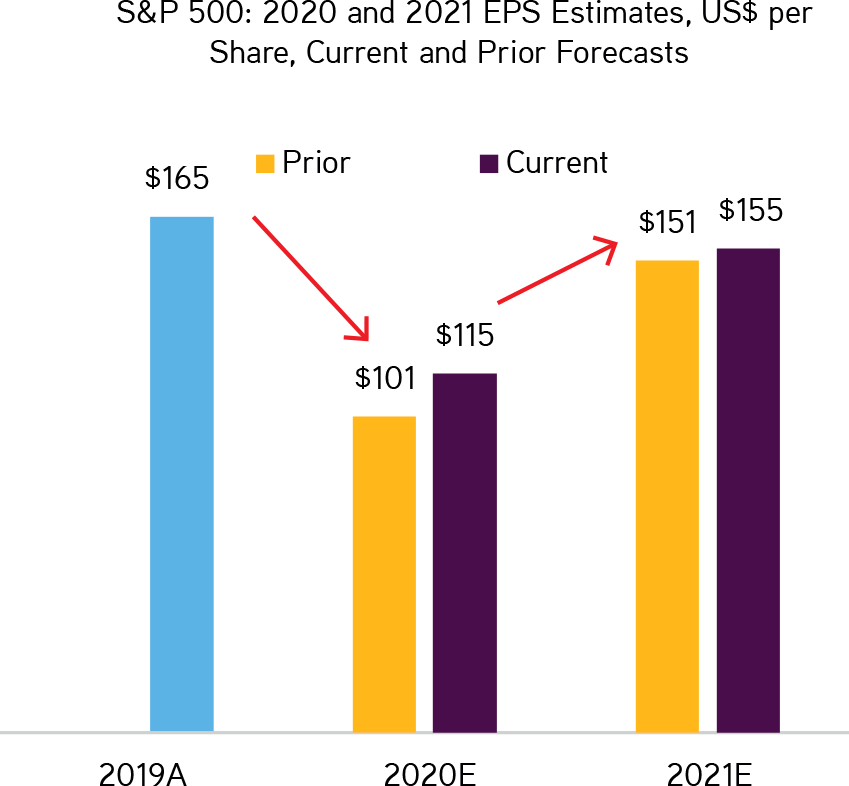
EXHIBIT 19
…Based on an Improved Outlook for Tech, Healthcare, Consumer Discretionary and Financials
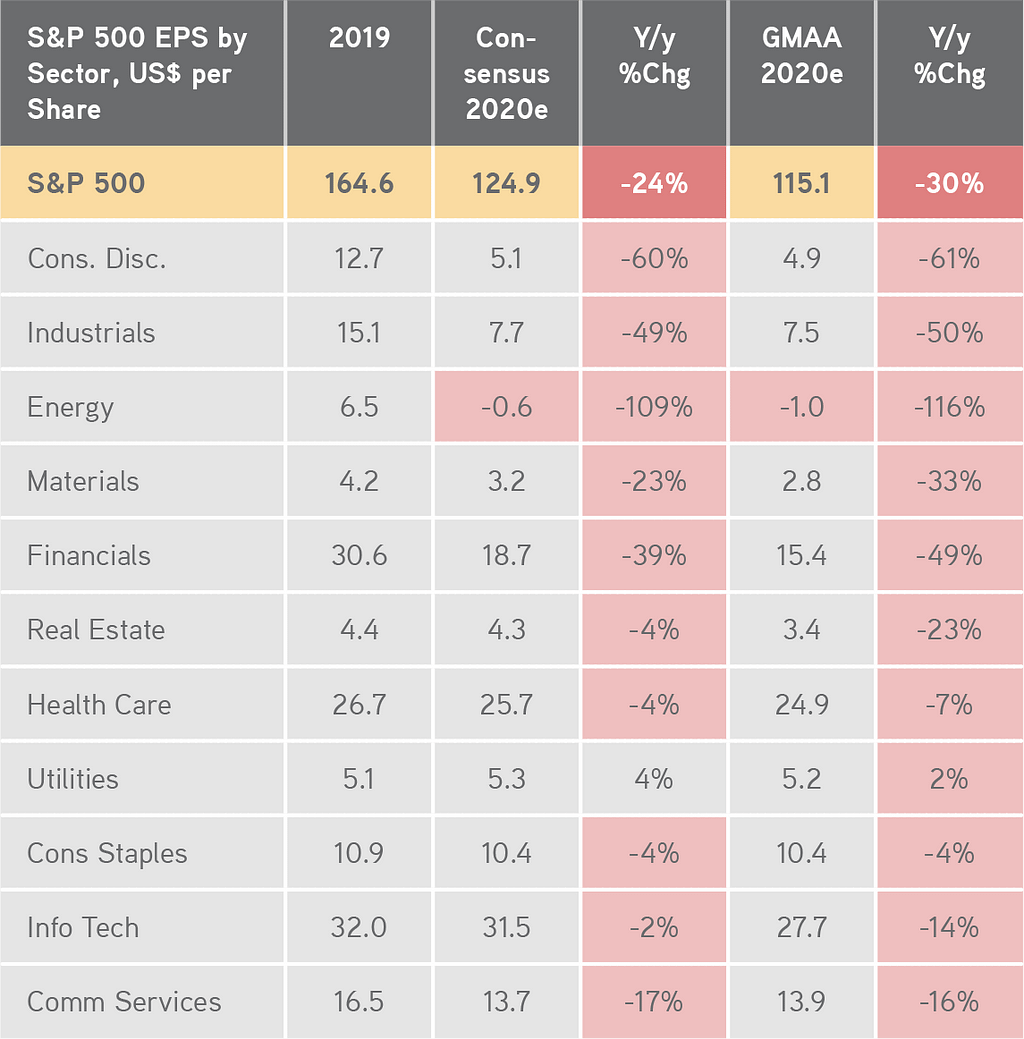
EXHIBIT 20
Our Valuation Framework Suggests the S&P 500 Is Now Close to Fair Value Unless the Risk Premium Drops Meaningfully From Current Levels
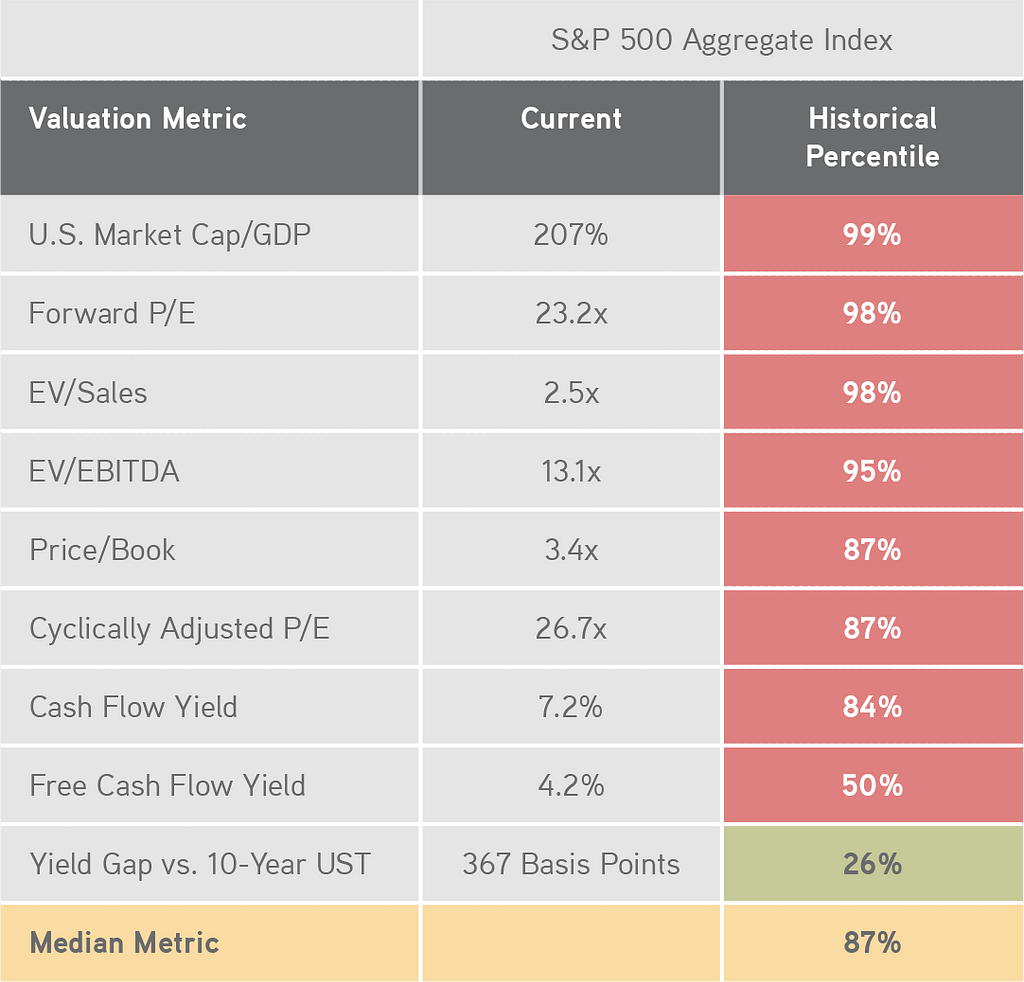
How are we thinking about fair value for the S&P 500? Under almost any traditional metric, equities — as measured by the S&P 500 — appear fully valued. A lower tax rate certainly has contributed to the market ‘looking’ more expensive, but the lion’s share of the apparent excesses just come from the market moving up so quickly in anticipation of a liquidity-induced recovery. One can see this in Exhibit 21, which shows that at present, the only support to valuation are interest rates (see yield gap versus the 10-year U.S. Treasury historical percentile).
EXHIBIT 21
The Market Looks Expensive on All Metrics Except Interest Rate-Adjusted Metrics. Importantly, Though, Interest Rates Do Matter
However, interest rates do matter, and as such, our models incorporate this input as well as longer-term cash flows. Specifically, to counteract these apparent contradictions on valuations, we rely more heavily on our dividend discount model, which factors in both long-term earnings and interest rates. As one can see in Exhibit 22, the market-implied equity risk premium (ERP) has recovered much more aggressively than many would have expected. In fact, it has already fallen to 5.35%, below both the March high of 6.0% and the post-Global Financial Crisis (GFC) average of 5.5%. This tightening actually makes sense to us, given the magnitude of the stimulus intended to quell unsettled financial conditions, even in the face of rising Chinese tensions and an upcoming election.
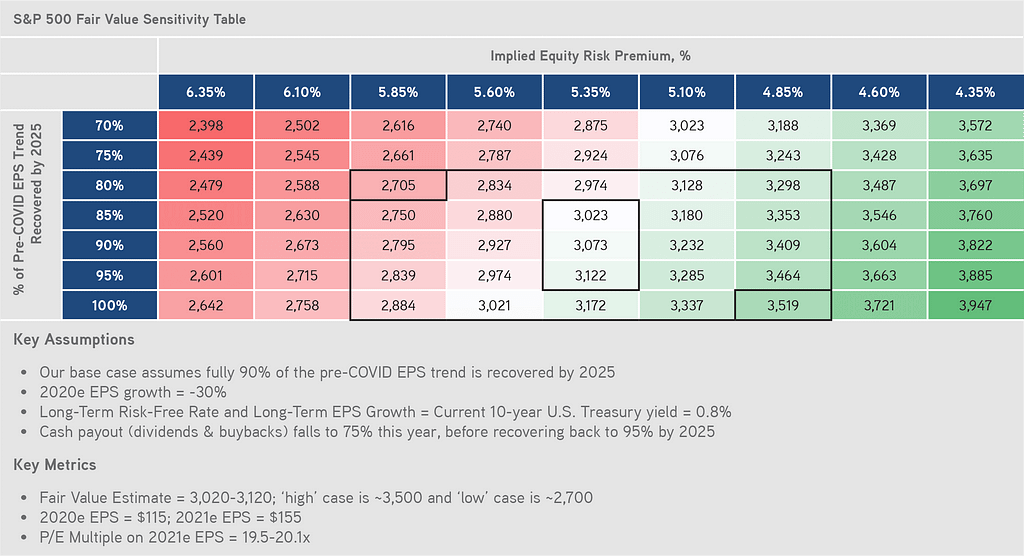
We also added an X-axis that incorporates how much demand there will be in 2025 relative to 2020 (e.g., an 85% score would imply that 85% of 2020 demand is present in 2025). We do this exercise because we believe that having a view on what stagnant unemployment means for overall consumption is a critical part of an analysis.
So, what is our punch line? Well, after taking into account the more benign risk premium and stronger EPS estimates and assuming that consumers recoup about 85–95% of their original pre-coronavirus demand, we now see S&P 500 fair value in the 3,020–3,120 range, which is up 6–7% from our old ‘estimate’ of 2,860–2,920. One can see this in Exhibit 20. As one might predict — given the tremendous uncertainty — we acknowledge the wide range of potential outcomes for the S&P 500. Our ‘high’ case of approximately 3,500 corresponds to 100% earnings recovery and the implied ERP moving towards the post-GFC lows of 4.8%. Our low case of approximately 2,700 corresponds to just 80% earnings recovery and the implied ERP hovering near the COVID peak stress level of six percent.
EXHIBIT 22
Given All The Fed Is Doing, We Expect the Equity Risk Premium to Be Slightly Below Its Post GFC Average
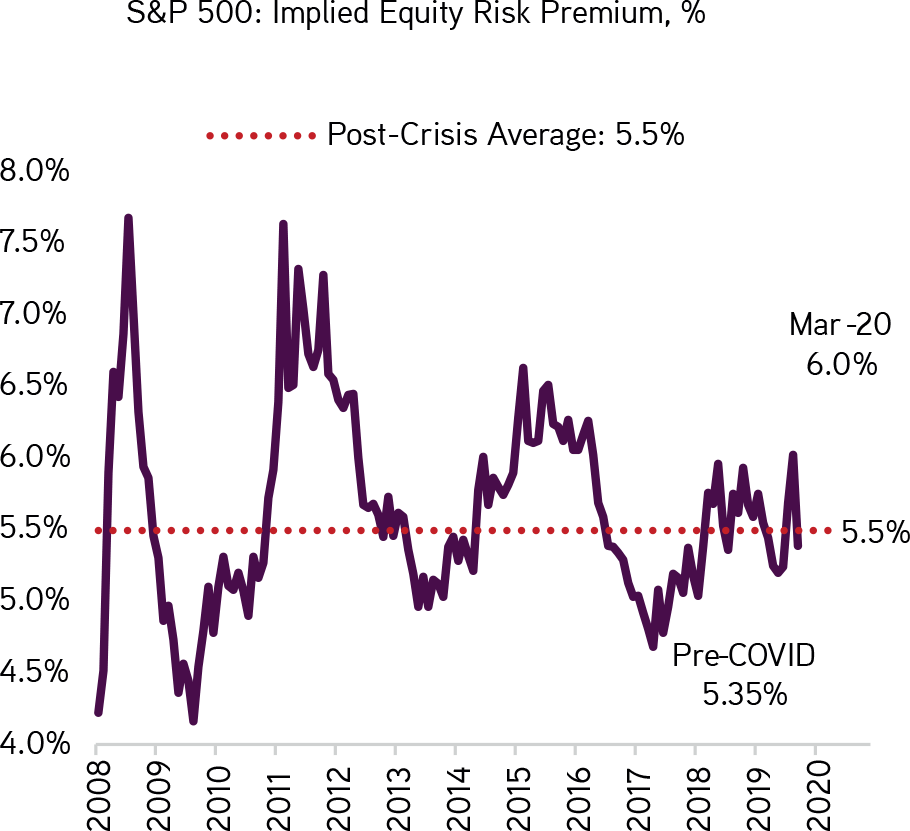
EXHIBIT 23
Markets Are Now Discounting That High Yield Default Rates Are Back Near the Historical Norm

On the Credit side, our work shows that the implied default rate for High Yield is now around 7.5%, compared to a peak of 14.8% in March and 5.9% at the beginning of June and a long-term historical average of 6.1%. According to our colleagues Chris Sheldon and Kris Novell in KKR’s Liquid Credit franchise, that level feels about right. While downgrades have slowed temporarily, we still see more ratings changes ahead. If we are right, it will ultimately put pressure on several parts of the Credit markets, including High Yield.
Against this backdrop, we expect volatility to continue through earnings season in July, and as such, Chris and Kris believe there will be good opportunities to buy high quality companies at discounts. We also expect more selling from the retail community, which could create attractive entry points during the next two quarters. Overall, we think the next phase of the market’s performance will be more driven by idiosyncratic credit risk across a wide variety of industries, where quality underwriting will play a role. Indeed, whereas the S&P 500 is 42% Technology and Healthcare, the High Yield index has just 13% of its face value in those two sectors.
Maybe more importantly than near-term gyrations across the capital markets is that — as we peer around the corner today on what tomorrow might look like — we see at least three key macro variables on which Credit and Equity investors should focus. First, employment, which we described earlier in significant detail, will likely be a major focus of our team. With consumption accounting for 60–70% of total GDP in many of the economies where we invest, unemployment trends become key ‘swing factors’ in sustainable GDP growth. No doubt, government programs are helpful in the near-term, but the market will ultimately trade off of sustainable consumption linked to wages and job creation by 2021.
Second, we continue to monitor closely COVID-related new cases, total cases, and hospitalization rates, the latter of the three (i.e., hospitalizations) now appearing to be the most important to the direction of market flows, we believe. We remain very aware that cases, a precursor to hospitalizations, are not tailing off in the U.S. the way that they are in Europe and China (Exhibit 1). Brazil, India, and parts of South East Asia also continue to warrant significant attention/caution. Our base view is that cases remain in the 25,000–75,000 range per day in the U.S. into the autumn months, so recent trends in early July are running at the high end of our estimated range. We also look for a vaccine to be in production in 2021, but we do not ascribe to the idea that we will totally be rid of the coronavirus in 2021. All told, we think that it will likely take up to two to three years to develop a vaccine and get it fully deployed — including potential booster doses. Even then, the virus will still be around, but at that point, hopefully, it will be more like the regular flu in terms of impact.
Third, we need to focus on the U.S. election and what it means not only for the Presidency but also for the Congress, the Senate in particular. It is still early days, but under a Biden administration, investors would need to focus on the following key areas of potential change:
- The corporate tax rate increases to 28% from 21%.
- A 12.4% Social Security surtax on income over $400,000. (Note that the Social Security payroll tax currently caps out at $137,700, so Biden’s plan would create a ‘donut hole’ between $137,700 and $400,000).
- The top tax bracket for personal income tax increases to 39.6% from 37%.
- Long-term capital gains rate increases to the ordinary marginal rate (39.6%) for earnings above $1 million.
- Significant regulatory changes possibly impacting multiple industries, particularly finance, housing, education, energy, health care/pharma and involving labor issues (minimum wage).
- More infrastructure spending, particularly on green infrastructure and incentives for green energy.
Importantly, as one can see in Exhibit 24, history sides with this analysis and also suggests that a change in leadership would likely result in an increase in taxes, particularly given the current socioeconomic and inequality issues the U.S. is now facing — the most extreme since the Great Depression.
EXHIBIT 24
Post World War II, the Average Corporate Tax Rate Was 42%. Today We Are At Just 21%, So the Bias Is Higher

EXHIBIT 25
As Inequality Spread, Tax Rates Climbed Notably After the Great Depression
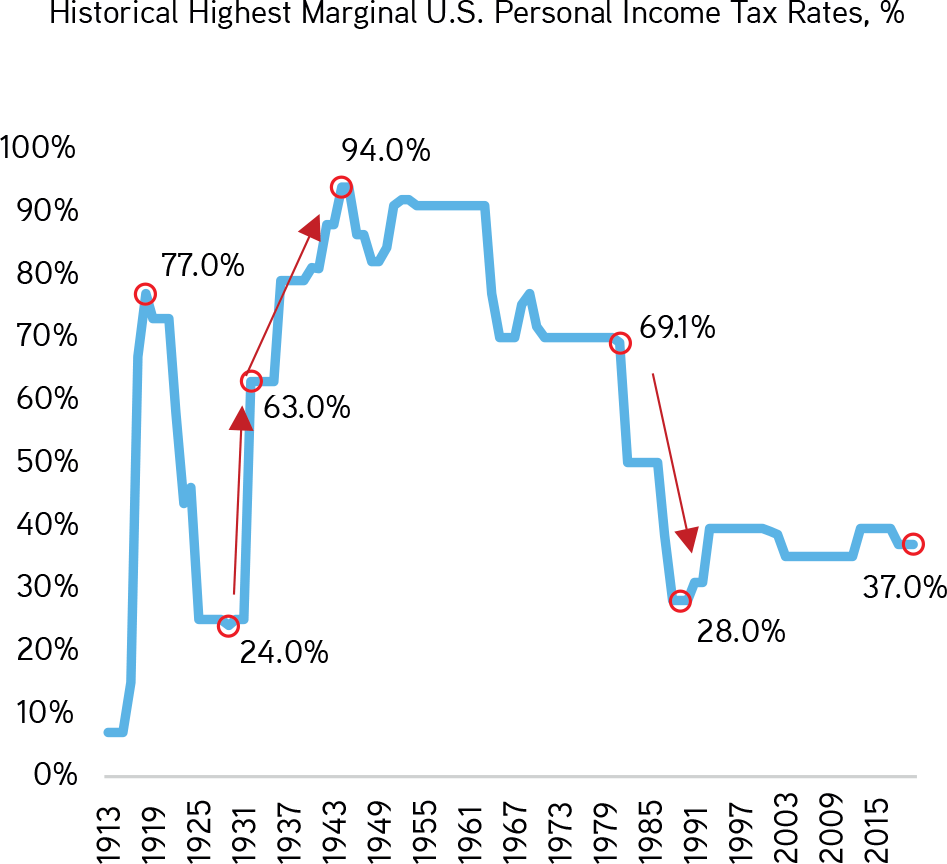
EXHIBIT 26
The Fed Has Altered the Playbook It Used in the Global Financial Crisis…

EXHIBIT 27
…and Is Ensuring That Money Supply Reaches Consumers More Readily Than Post GFC

Our bottom line is two-fold. First, the sheer amount of near-term liquidity is not to be underestimated, and as such, we would likely give the benefit of the doubt to the view that stocks and bonds are not as much at risk for a dramatic market decline as some market pundits now think. One can see the sheer magnitude of the response by the Fed in Exhibits 26 and 27, respectively. All told, the Federal Reserve has increased the money supply by 13–14% in just 15 weeks, which is almost four times more than it did during the Global Financial Crisis. Its balance sheet is now $7.1 trillion, up from $4.2 trillion pre-corona virus, but below the $9 trillion it could reach by year-end. On the fiscal side, the government has ‘only’ spent $1.5 trillion of the $3 trillion that has been allocated (and this is before the additional $1-$1.5 trillion that we think could be coming in the second half of the year). That is good news for financial assets, particularly when we expect U.S. Real GDP to contract by almost seven percent this year and only grow low single digits in 2021.
Second, while hard to do, we need to separate the economy from the markets in the near-term. In our humble opinion, the markets are poised to handily outperform the economy in 2020. Beyond the liquidity surge we are all seeing, many stocks in the S&P 500 actually benefit from the economic shift towards e-commerce, nesting, and cloud computing. The longer-term bad news, however, is that the intensity of the shift towards digitalization means higher sustained unemployment throughout the economy will eventually affect consumption. Said differently, governments cannot continue to support the economy and the markets indefinitely. Ultimately, it likely means that there will be a lot of smaller-to medium-sized businesses that are unable to compete in the macroeconomic environment we are envisioning. If we are right, the markets will eventually respond to this overhang, which may include greater regulation and taxation as well as less favorable financial conditions.
Question #3: How are you thinking about inflation versus deflation?
Since arriving at KKR in 2011, we have consistently been in the camp of low inflation and low rates. One can review our train of thought in several publications (e.g., see Insights pieces from 2019 The Uncomfortable Truth and 2018 Rethinking Asset Allocation). There have been several important inputs through the years that have driven our thinking. First, we have been living in a world where central bank liquidity has not led to an increase in the money multiplier. In fact, since the Federal Reserve announced the two percent inflation target in 2012, it has not hit its goal for a calendar year. Indeed, going back to 1996, there have been only four years when inflation exceeded the target (2004 to 2007)1. For the ECB, it has missed every year since 2013. What’s going on? For starters, as technology continues to improve (faster and more powerful computers, lighter and bigger televisions, more productive smartphone apps, and so on), the relative price of technology continues to decline. Building off a report by Joseph Davies, Chief Economist at Vanguard, we note that the lower prices for business and consumer technology products have produced an average estimated drag of forty basis points per year in the official Consumer Price Index (CPI)2.
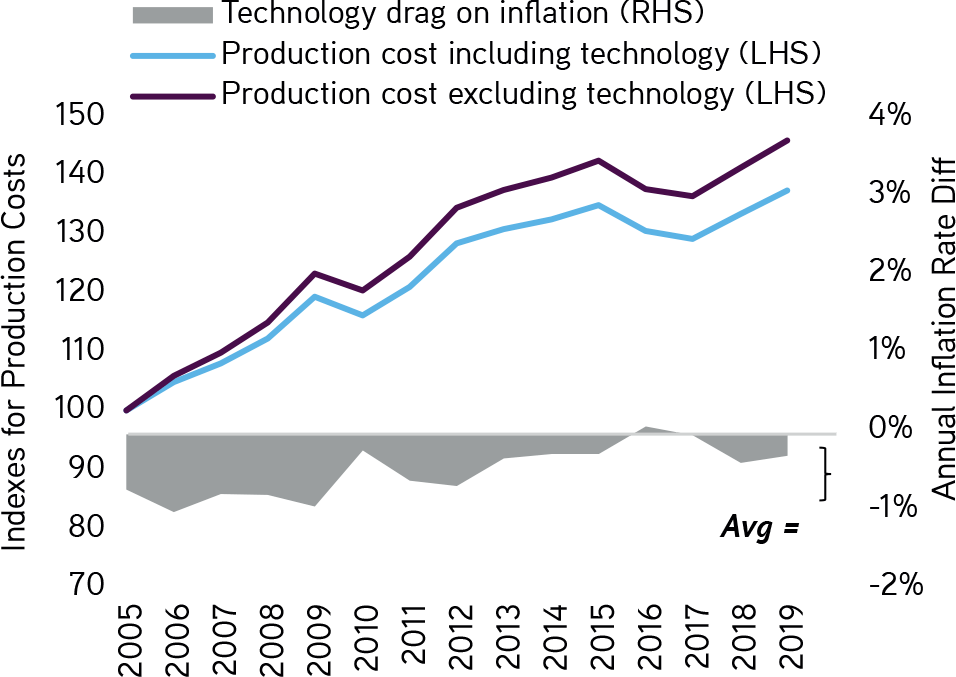
But Moore’s Law is certainly about more than mobile apps, video games, and hand-held devices. As technology is used more prominently to produce more goods and services, many of the companies in which our clients invest are now enjoying lower production costs. This observation is significant, as prices charged by our portfolio companies are just markups over marginal production costs, and as such, the continued adoption of new technologies generally translates into reduced unit costs of production.
Over time, these benefits make their way to consumers in the form of lower, or less rapidly increasing, final prices, even in sectors not directly related to technology. As we show in Exhibit 29,Moore’s law in technology has had a profound effect on the prices that U.S. businesses need to charge and still make a decent profit. All told, since 2005, for example, the declining prices of computer and electronic products, computer design and services, and other technology inputs have trimmed 83 basis points from overall production costs and ultimately from final prices in some instances. Interestingly, as Exhibit 28 shows, the impact of technology on inflation is typically more pronounced in the early years; thereafter, the impact becomes more moderate as the technology costs decrease.
EXHIBIT 28
Moore’s Law Is a Drag on Inflation, Particularly in the Early Years of Innovation
Note: In the BEA’s input-output data (I-O), we identified technology-related inputs as follows: computer and electronic products; broadcasting and telecommunications; data processing, internet publishing, and other information services; and computer systems design and related services. We identified as closely as possible Producer Price Index (PPI) series for each industry in the I-O, including all four technology inputs. The weightings were multiplied by technology’s PPI to arrive at the contribution to each industry’s PPI. For each industry’s PPI minus technology, we subtracted the tech contribution from PPI and divided it by one minus technology’s weight. Data as at 2005 through 2018. Source: KKR Global Macro & Asset Allocation calculations, Haver Analytics, BEA, BLS, Vanguard.
EXHIBIT 29
Technology’s Effect on Prices by Industry Has Been Significant in Recent Years
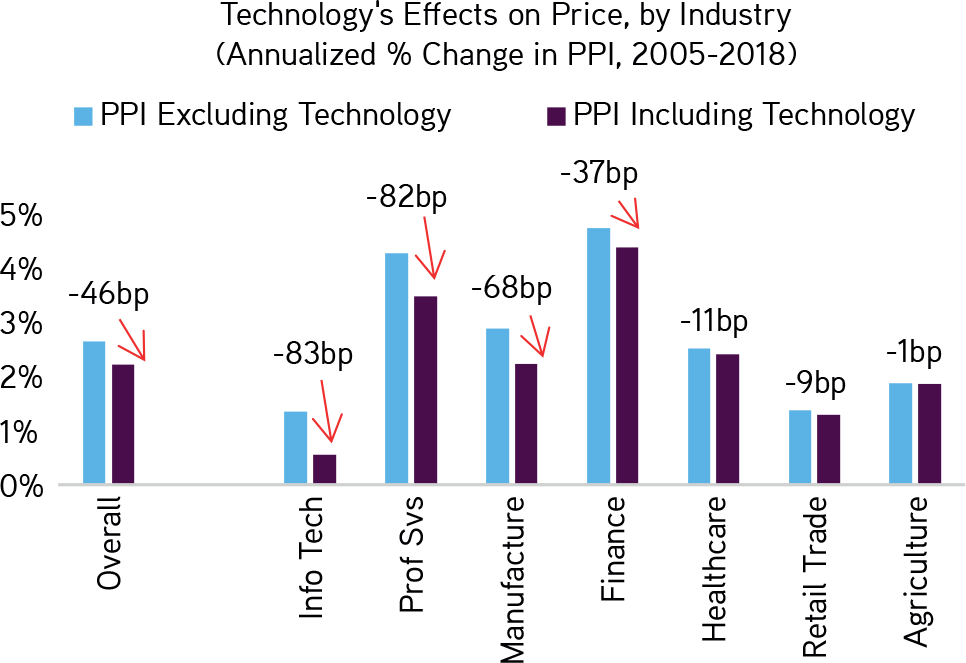
Note: In the BEA’s input-output data (I-O), we identified technology-related inputs as follows: computer and electronic products; broadcasting and telecommunications; data processing, internet publishing, and other information services; and computer systems design and related services. We identified as closely as possible Producer Price Index (PPI) series for each industry in the I-O, including all four technology inputs. The weightings were multiplied by technology’s PPI to arrive at the contribution to each industry’s PPI. For each industry’s PPI minus technology, we subtracted the tech contribution from PPI and divided it by one minus technology’s weight. Data as at 2005 through 2018. Source: KKR Global Macro & Asset Allocation calculations, Haver Analytics, BEA, BLS, Vanguard.
EXHIBIT 30
Deleveraging Will Likely Put Secular Pressure on Inflation. In Fact, There Are Currently No Good Examples of Developed Countries Inflating Their Way Out of Debt Outside of Wartime Events
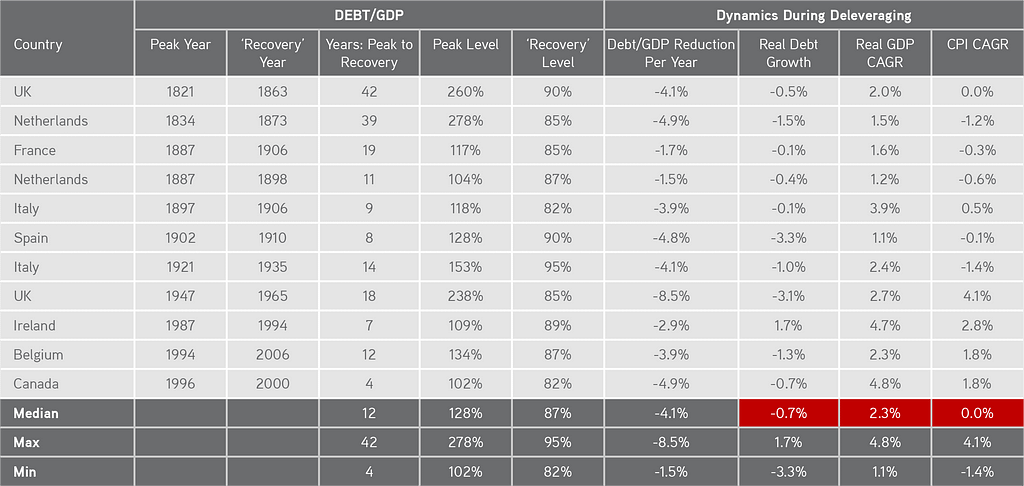
Italian lira devalued 40% on 10/4/36; UK pound devalued 30% on 9/19/49; Irish punt devalued 10% on 1/31/93. Source: KKR Global Macro and Asset Allocation team analysis of annual data from 1821–2006 available on reinhartandrogoff.com.
Beyond technology’s downward pressure on inflation, there are other forces to consider. For example, our work shows that government deleveraging cycles are almost always deflationary. In fact, most government deleveraging cycles lead to a contraction in inflation rates — not what we had originally thought when we started researching this topic. One can see this in Exhibit 30.However, given how low rates are and high political tensions are, we do acknowledge that deleveraging in the near-term could be quite muted. Little regard for bulging deficits by both conservatives and liberals in most countries is also an input worth considering. As such, a lot of the deleveraging we expect in the near-term is likely to come from the corporate, not the government, sector.
EXHIBIT 31
Demographic Shifts Have Had a Net Negative Effect on the Natural Rate of Interest

Note: The above depicts three scenarios of the impact of demographics on the neutral rate: The yellow line depicts the total decline in the neutral rate from 3% in 1990 to 1% by 2016. The purple line corresponds to the impact driven only by the decline in population growth from 1% in 1990 to 0.3% in 2100. The blue line corresponds to what the neutral rate would be if we accounted only for the increase in life expectancy from 75 to 91 years over that period, while holding population growth constant. Data as at March 2016. Source: Carlos Carvalho, Andrea Ferrero, and Fernanda Nechio, “Demographics and Real Interest Rates: Inspecting the Mechanism,” Federal Reserve Bank of San Francisco.
EXHIBIT 32
As the U.S. Population Ages, It Will Likely Lead to Slower Growth, More Outlays By the Government, and More Savings By Retirees

Data as at February 10, 2020. Source: Office of Management and Budget, Haver Analytics.
Meanwhile, as Paula Roberts discussed in her 2018 Viewpoints note What Does Population Aging Mean for Growth and Investments?, the demographic headwinds of increased longevity and declining population growth rates also lower the natural rate of interest, which is the rate that neither stimulates nor cools down the economy and the one used by monetary policymakers when making decisions about raising rates to prevent inflation. With increases in life expectancy and longer retirements, individuals are incentivized to save to fund retirement and are much more cautious on spending, particularly given rampant economic uncertainty and current pension underfunding concerns. This boost to savings at the expense of current consumption — over time — puts downward pressure on interest rates.
The offset of all these disinflationary forces is that we are now embarking on not only Quantitative Easing on the monetary side but also Quantitative Easing on the fiscal side. This change is an important one, and it warrants a lot of attention because it could represent a regime change. Indeed, in the old regime, M (money) x V (velocity) = P (price) x G (Goods) resulted in M going up but V going down, so that nominal GDP, or P x G, stayed low. This cycle, however, feels different because the government is doing not only monetary quantitative easing but also fiscal easing via direct consumer deposits and enhanced unemployment benefits that are often in excess of the regular take-home pay. In this scenario — where consumers get money directly into their bank accounts versus having to worry about banks’ lending the money out — nominal GDP could finally accelerate, as increased demand from consumers accelerates the velocity of money supply. We could even see inflation accelerate further in this scenario if supply chains are tight because of re-shoring or business shutdowns.
EXHIBIT 33
The Amount of Global Stimulus Has Been Breathtaking, But We Actually Believe There Is Likely More to Come
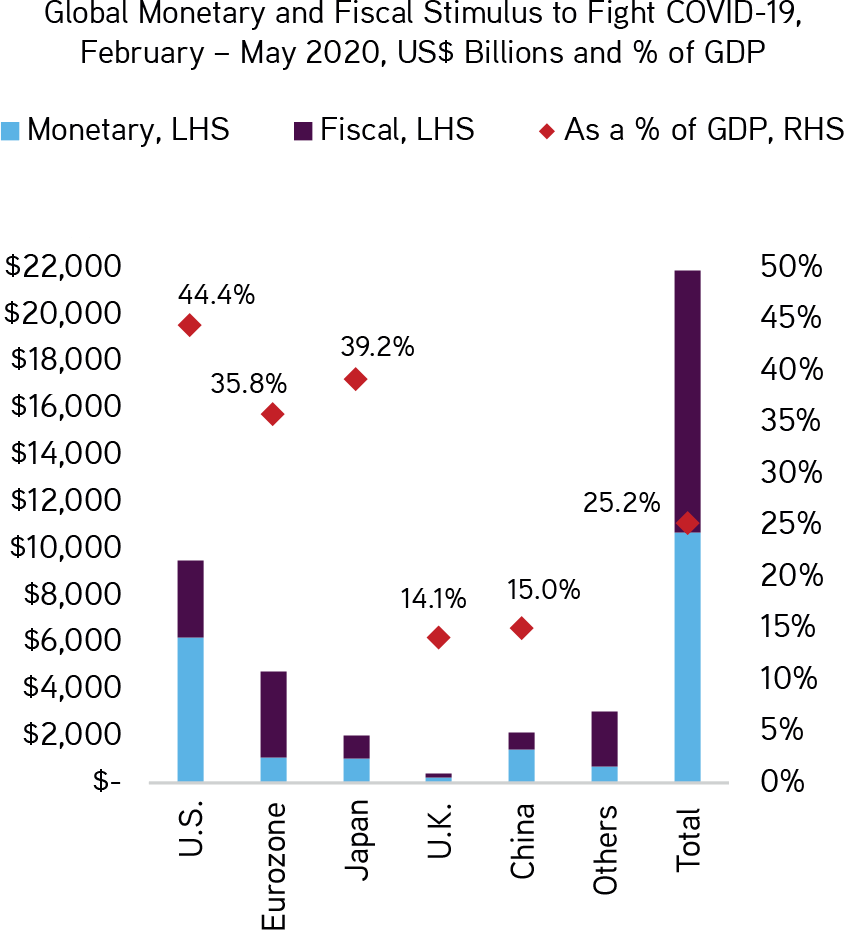
Data as at May 27, 2020. Source: Cornerstone Macro.
EXHIBIT 34
Based On Announcements So Far, the Balance Sheets of the G4 Could Expand by 28% of GDP by Year-End 2021
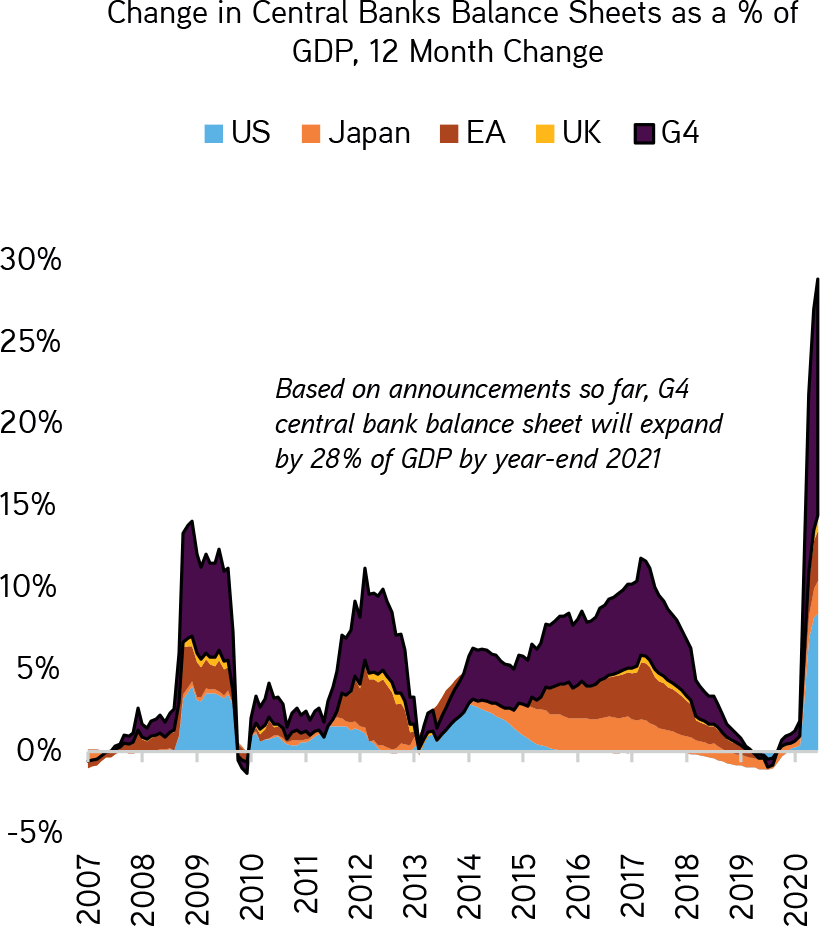
Data as at June 30, 2020. Source: Morgan Stanley Research, Federal Reserve Board, Haver Analytics.
We also want to reflect heavily on the fact that Chairman Powell opened the door to yield curve control (YCC) in the June Federal Reserve meeting, noting that it will remain under discussion. Importantly, we found it surprising that he volunteered this in his opening remarks rather than making a general comment when asked. Why is his commentary so important, even though he downplayed it a few weeks later? Well, it suggests to us that the Fed is clearly in ‘do whatever it takes mode’ to stoke some inflation. Indeed, the history of yield curve control suggests that some form of inflation is coming. One can see this clearly in Exhibit 41, which shows that holding nominal interest rates below nominal GDP for an extended period of time ultimately did usher in an era of higher inflation. Also, as we show in Exhibit 37, owning some Real Assets like Housing and/or Infrastructure makes sense as a hedge. The 1940–50s experiment by the Federal Reserve, which we detail in Exhibit 36, also suggests that the price-to-earnings ratios could increase further if history is a guide (Exhibit 35), though this phenomenon is now better understood by the market, in our view. Hence, our base case for asset allocation professionals is that multiples for equities do not expand at the same rate that valuations in many parts of Real Assets do.
EXHIBIT 35
Yield Curve Control in March 1942 Actually Coincided With Multiple Expansion at the Introduction of the Policy

Data as at May 31, 2020. Source: Robert Shiller, Bloomberg.
EXHIBIT 36
1940–50s Yield Curve Control Coincided With a Rally in U.S. Stocks…
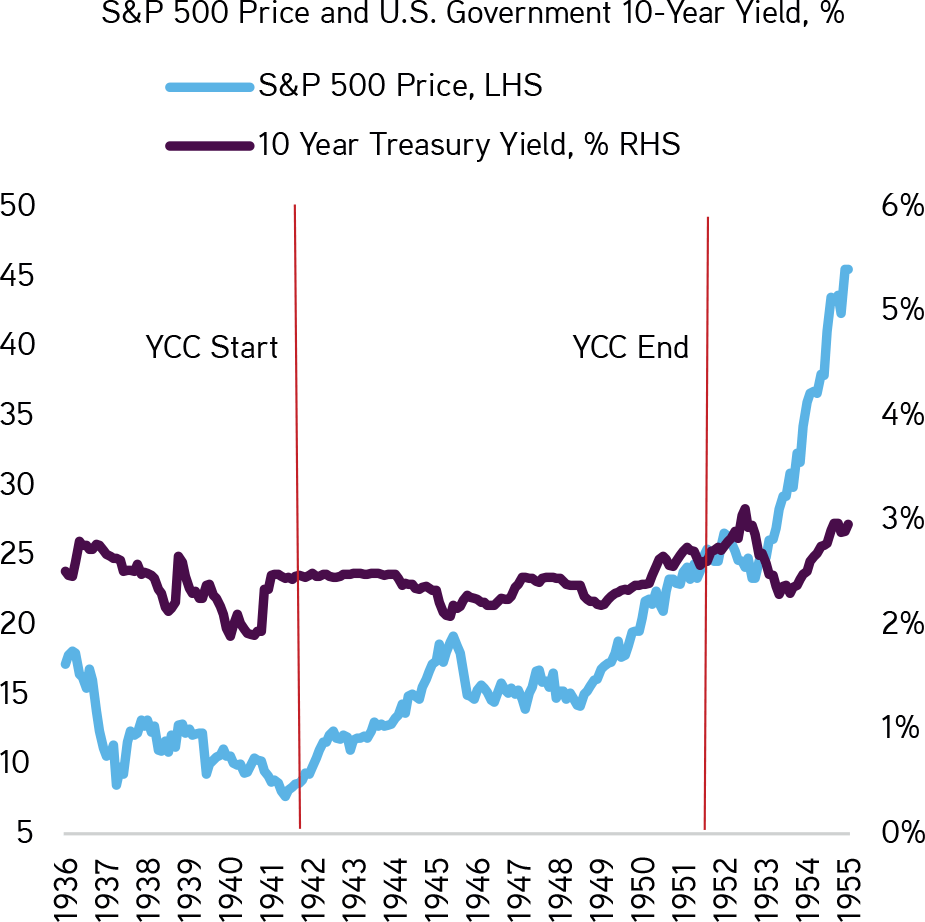
Data as at May 31, 2020. Source: Robert Shiller, Bloomberg.
EXHIBIT 37
…and an Inflection Point in U.S. Real Estate Prices. In Our View, There Is a Greater Possibility That House Prices Appreciate More Than Equity Multiples if YCC Does Get Implemented
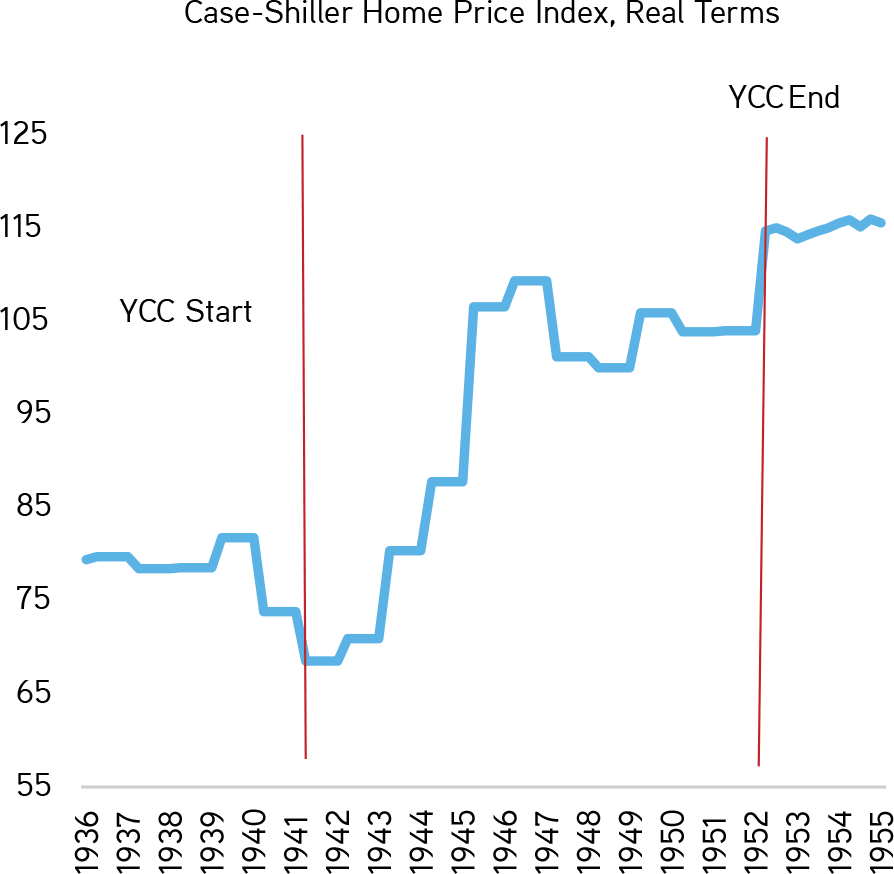
Data as at May 31, 2020. Source: Robert Shiller, Haver Analytics.
Importantly, we want to confess that we don’t yet know the long-term answer on the inflation question. It is just too early in the experiment. To date, all the near-term economic indicators are suggesting deflationary rather than inflationary risk. In fact, inflation prints across Europe, Japan, and the U.S. are all coming in below consensus expectations and, maybe more importantly, below central bank targeted levels. The key headwind to an acceleration in inflation remains that the increase in money supply is not leading to an increase in the money multiplier (Exhibit 39), an important underpinning to our thesis. In fact, some really interesting work done by my colleague Dave McNellis shows that, while U.S. bank balance sheets have increased by $600 billion, more than 100% of the increase came from companies drawing down revolvers (a defensive measure) and Paycheck Protection Loans (government–backed small business loans being disbursed to help small businesses from going out of business and keep employees on the payroll) versus growth capital for pro-cyclical initiatives such as capital expenditures. Hence, our view that inflation will remain subdued for at least the next 12–24 months.
EXHIBIT 38
The U.S. Money Supply Is Booming, But…
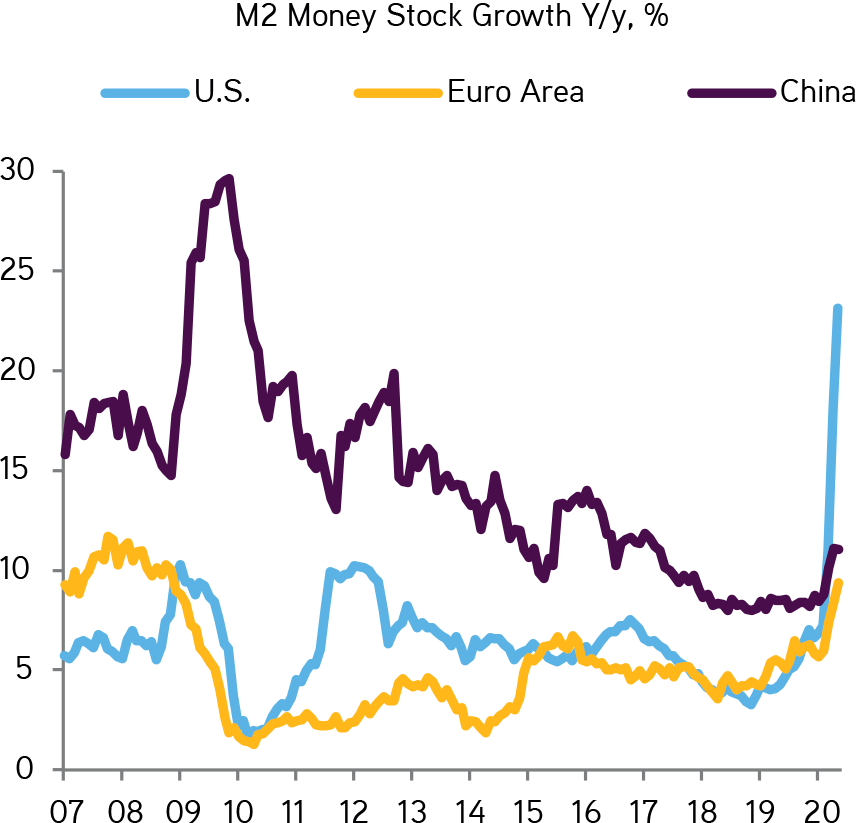
Data as at May 31, 2020. Source: BEA, Federal Reserve, Haver Analytics.
EXHIBIT 39
…the Money Multiplier Is Not. We Expect It to Remain Sluggish in the Near-Term
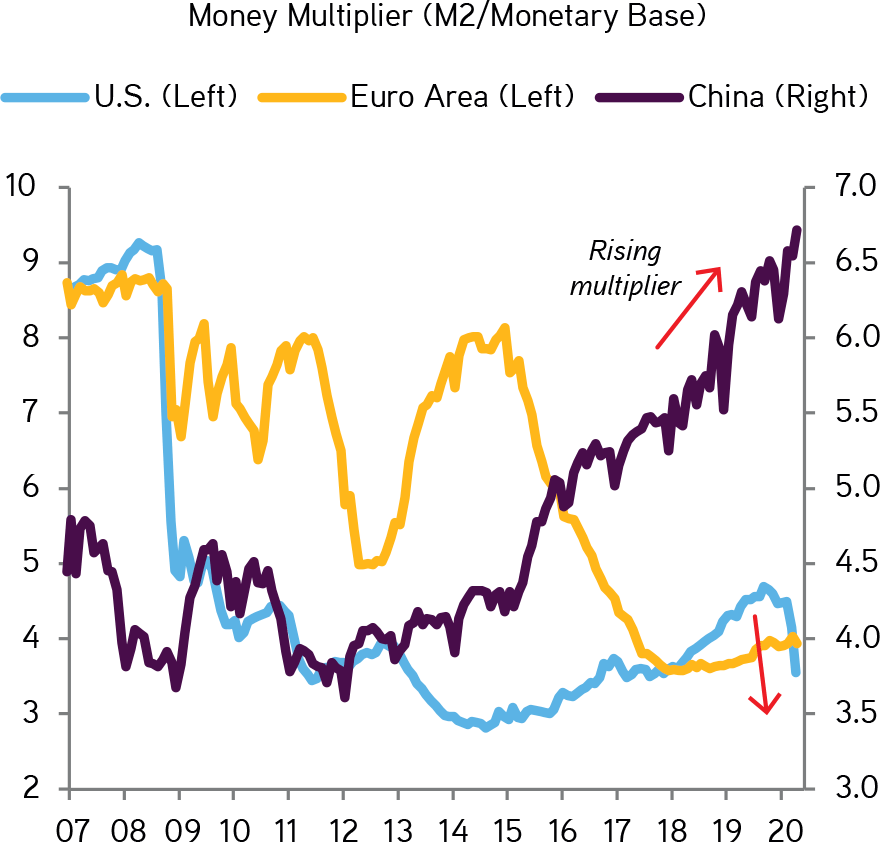
Data as at May 31, 2020. Source: BEA, Federal Reserve, Haver Analytics.
EXHIBIT 40
Money Supply Growth, in the Absence of Velocity, Is Not Inflationary
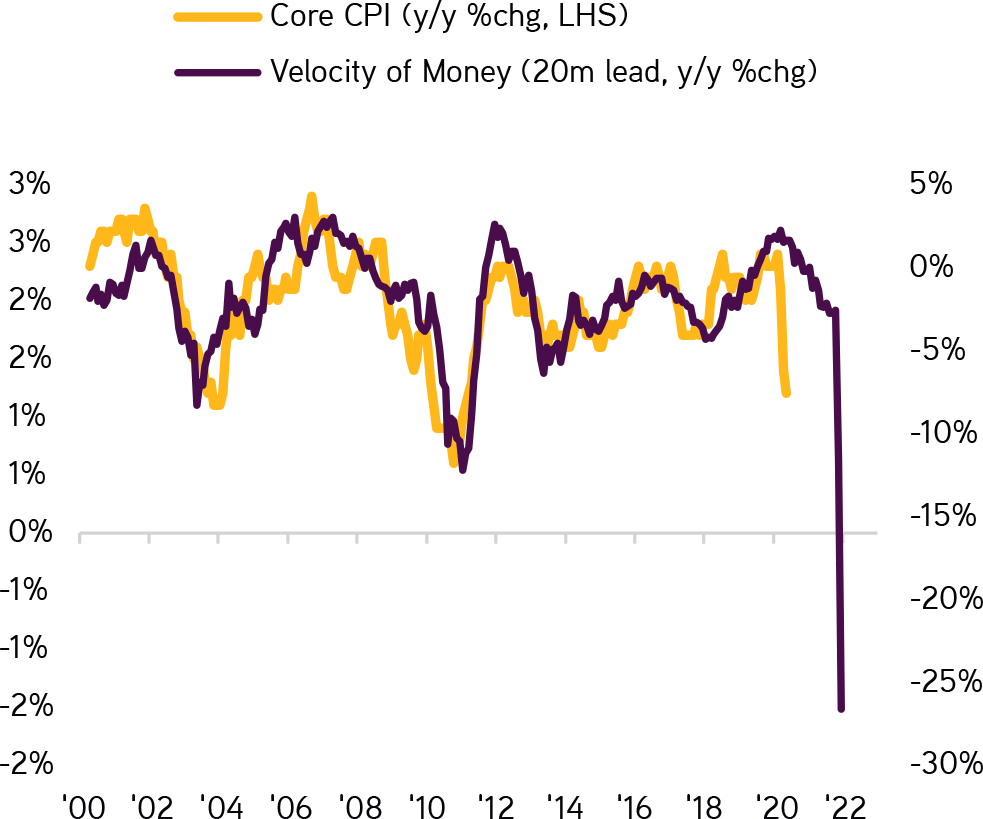
Note: Velocity of money is nominal GDP divided by M2. Data as at May 31, 2020. Source: KKR Global Macro & Asset Allocation, Haver Analytics, FRB, BLS.
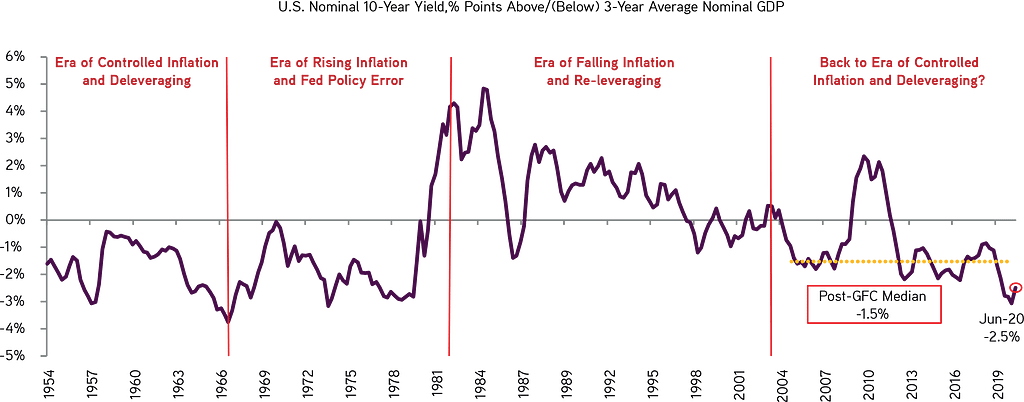
EXHIBIT 41
Rates Run in Long-Term Regimes Relative to GDP. The Current Regime Is for Rates Approximately 100–250 Basis Points Below Trend Growth. We See It Staying Here for the Next Few Years, But We Are Watching for Any Change in the Money Multiplier
Data as at June 17, 2020. Source: Bureau of Economic Analysis, Federal Reserve, Haver, KKR Global Macro & Asset Allocation analysis.
Ultimately, though, we should be clear about the government’s long-term intentions. Specifically, by holding nominal interest rates below nominal GDP, the government is trying to stoke some inflation to alleviate over-indebtedness by almost everyone these days. Importantly, though, as we show in Exhibit 41, these initiatives can take years to play out, and they actually often require a policy mistake or external shock along the way to stoke the type of inflation the U.S. experienced in the early 1970s.
From an asset allocation standpoint, however, we just don’t think that we can sit idly by and wait to see if a regime change is upon us, particularly given 1) the significant size of the stimulus that has been added to the system; and 2) the reality that the government is now bypassing the banking system and giving money directly to consumers. The risk of this cycle being different than post-2009 is much higher. So, against the current backdrop, we suggest — until we have greater visibility on the long-term direction of inflation — an overweight to Asset-Based Finance in Credit (with a focus on Housing), Infrastructure with pricing power and cash flow (e.g., Optical), and dynamic parts of Real Estate (e.g., Logistics, Warehouses, etc.) We also still favor Gold and TIPS as part of a diversified Real Assets Portfolio.
EXHIBIT 42
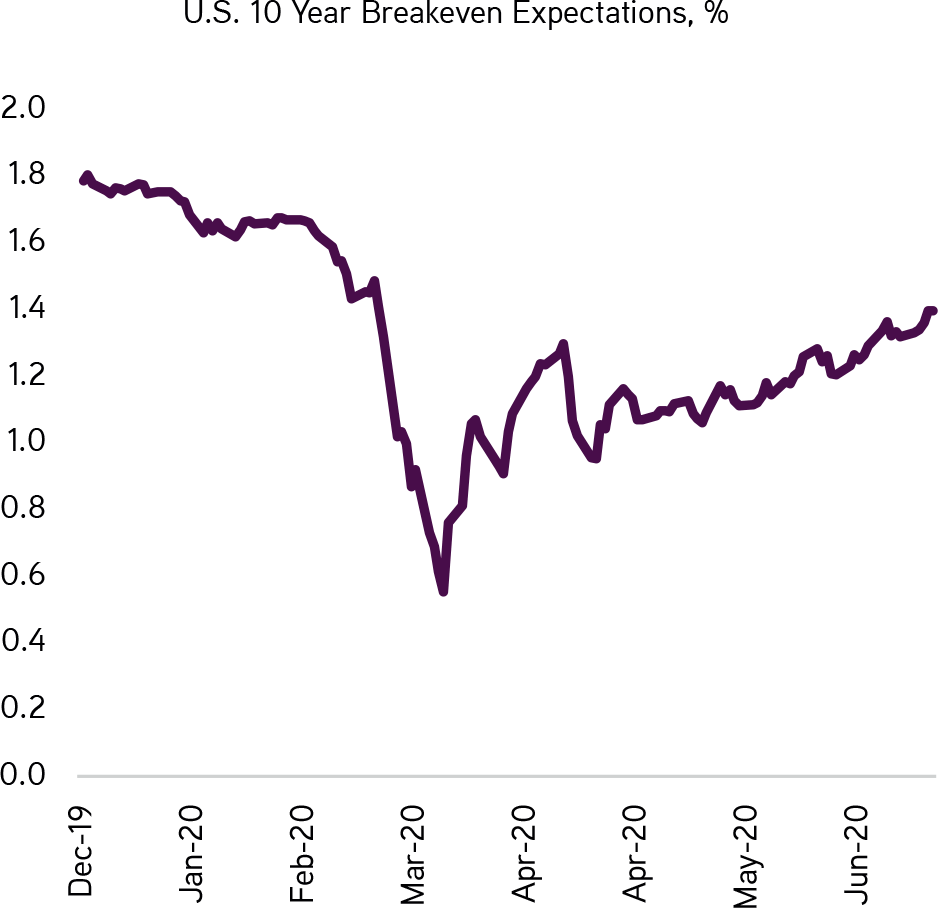
Inflation Expectations Have Slowly Been Creeping Upwards From the Freefall in March 2020, But They Remain Well Below the Fed’s Goal of Two Percent
Data as at July 2, 2020. Source: Bloomberg.
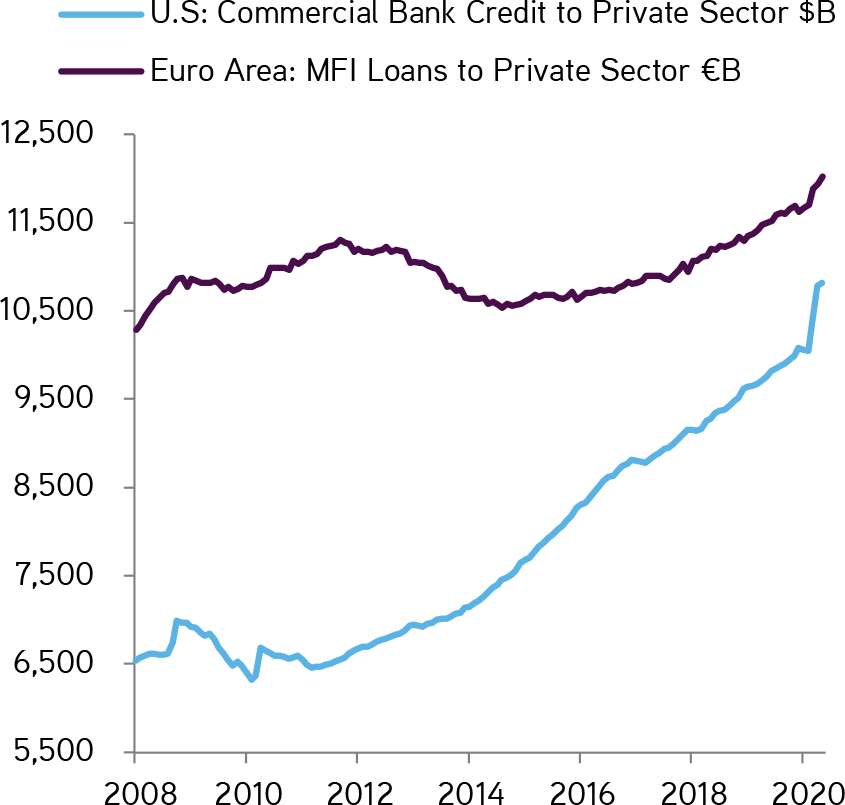
EXHIBIT 43
Bank Lending Has Picked Up in Both the U.S. and Europe, But the Majority of the Increase Is Linked to Revolver Drawdowns and Government Programs, Not Fundamental Lending
Data as at May 31, 2020. Source: EBC, Federal Reserve, Analytics.
Question #4: Asset Allocation: Where are we headed and what changes to asset allocation should we consider?
I am not sure what exact situation if any Albert Einstein had in mind when he said “the measure of intelligence is the ability to change,” but rarely have his words been as poignant as they are today. Indeed, given the enormity of change we are seeing in deficits, in the level of money growth, and in geopolitical relationships, we believe that every portfolio manager and asset allocator needs to think about the future through a different lens. We certainly have changed our thinking, including a more conservative outlook for expected returns across many asset classes. One can see our latest estimates in Exhibit 44.
Interestingly, though, following a series of illuminating conversations with leading CIOs from around the world, our strong belief is that a lower return profile for most asset classes will encourage more, not less, risk taking. There are several underpinnings to our thesis. First, there is an actual shortage of true income producing assets available in the liquid credit and sovereign markets. As a result, CIOs will have to go further out on the risk curve, including Asset-Based Finance, High Yield, Infrastructure, Opportunistic Credit, and even high dividend yielding stocks.
Second, given the significant decline in interest rates, the income and diversifying benefits of government bonds cannot enjoy the same level of performance that they did in recent years. Against this backdrop, investors will have to use more non-traditional assets/strategies to create portfolios that are resilient during market sell-offs. To this end, we analyzed the performance of Gold during all of the S&P 500 corrections and bear markets since 1975, and our work shows clearly that Gold offers diversification benefits during equity drawdowns (Exhibit 47). Specifically, around two-thirds of the time, Gold’s performance is actually positive during these risk-off events. Third, allocators will probably need to allocate more towards Alternatives, or areas where they can better harness the illiquidity premium. The simple math is that the illiquidity premium becomes more valuable as a percentage of the overall total return in a portfolio when expected returns are falling.
EXHIBIT 44
We Generally Look for Lower Returns Across Many of the Asset Classes We Forecast

Data as at June 30, 2020. Source: Bloomberg, Haver Analytics, Cambridge Associates, KKR Global Macro & Asset Allocation analysis.
EXHIBIT 45
Our Work Shows That a Traditional 60/40 Portfolio Will Now Struggle to Deliver the Same Type of Returns It Has in the Past. In Fact, Our Base Case for a 60/40 Split Is Now Less Than One Percent, Compared to 8.5% for the Past Five Years
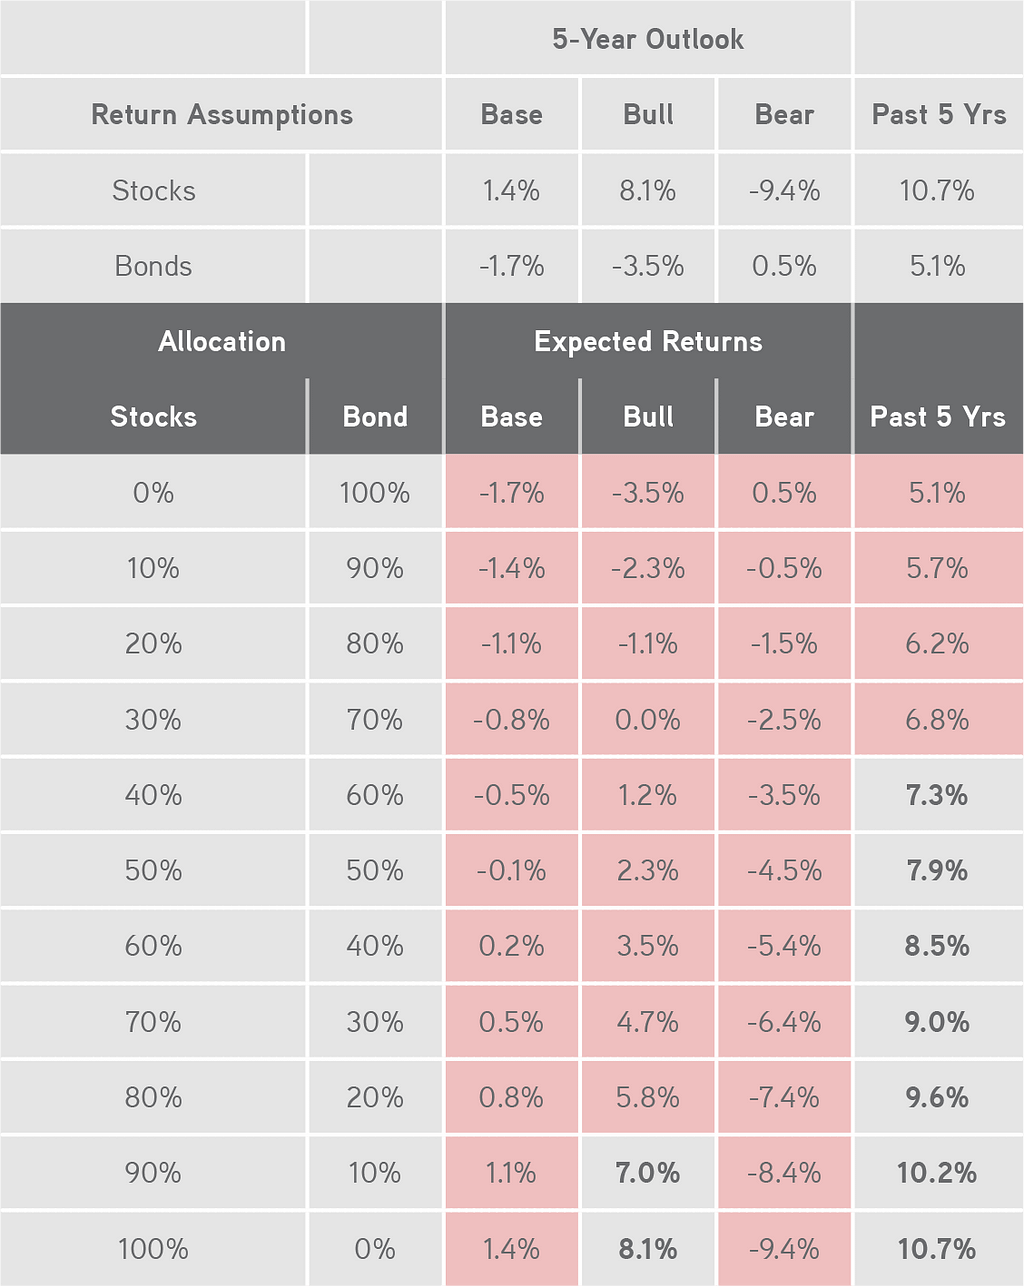
Data as at June 30, 2020. Source: KKR Global Macro & Asset Allocation analysis.
EXHIBIT 46
The Lower the Starting Yield, the Lower the Subsequent Return
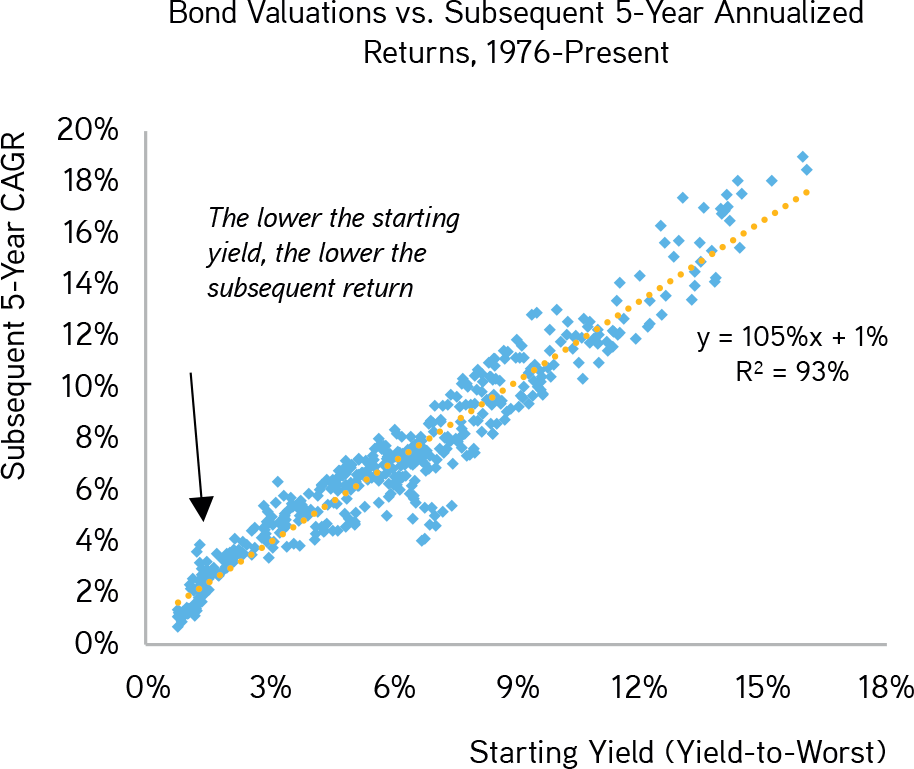
Note: Barclays U.S. Treasury Index (LUATTRUU Index) is used for the calculations. Data as at April 30, 2020. Source: Bloomberg, KKR Global Macro & Asset Allocation analysis.
EXHIBIT 47
Gold Offers Diversification Benefits During Equity Drawdowns and Its Performance Is Positive Around Two-Thirds of the Time During Risk Off Events

Data as at May 31, 2020. Source: Bloomberg.
We also believe that CIOs will need to look for ways to arbitrage benchmark indices to generate alpha/returns. For our nickel, within the world of Private Equity, we believe that more allocators will replace parts of their Public Equity portfolio with increased Private Equity allocations across most major international markets. While the S&P 500 has been a stellar performer in the liquid markets, the same cannot be said for the European public equity markets. Indeed, as many of our readers will know, my colleague Aidan Corcoran and I have argued for some time that European private markets are well positioned to outperform the public markets. Key to our thinking has been that European public market indices are compositionally flawed because they do not reflect many of the positive growth areas that our macro work has uncovered. Consistent with this view, European public indices, the Eurostoxx in particular, are overweight financial institutions and underweight companies linked to services and innovation, including technology. As such, we have been advocating for private markets portfolio construction that includes a heavy tilt towards services, especially technology, business services, e-commerce, and logistics at the expense of lending and insurance companies.
This top-down insight has served us extremely well, as the ability to earn excess return provided by the private markets’ illiquidity premium — and then some — has been quite outsized in recent years. All told, European Private Equity has returned 8x multiple of invested capital (MOIC) over 20 years versus only 2x MOIC for European Public Equities. One can see this in Exhibit 49 which really provides a surprising visual of the bifurcation in performance about which we have been talking.
EXHIBIT 48
Europe Public Market Indices Are Heavily Overweight Financials and Underweight Tech. The Private Markets Have Employed a Very Different Portfolio Construction Approach
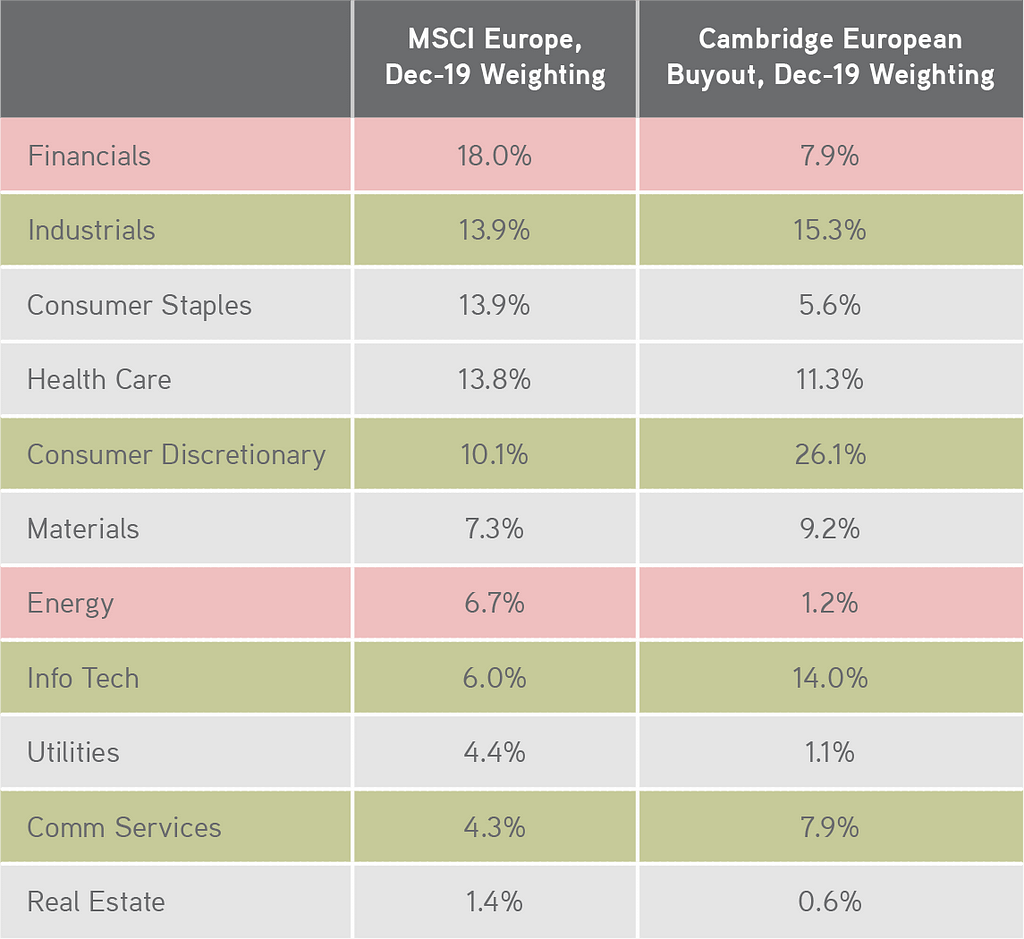
Data as at December 31, 2019. Source: MSCI.
EXHIBIT 49
The Illiquidity Premium in Europe Has Been Substantial in Recent Years. We See This Trend Continuing
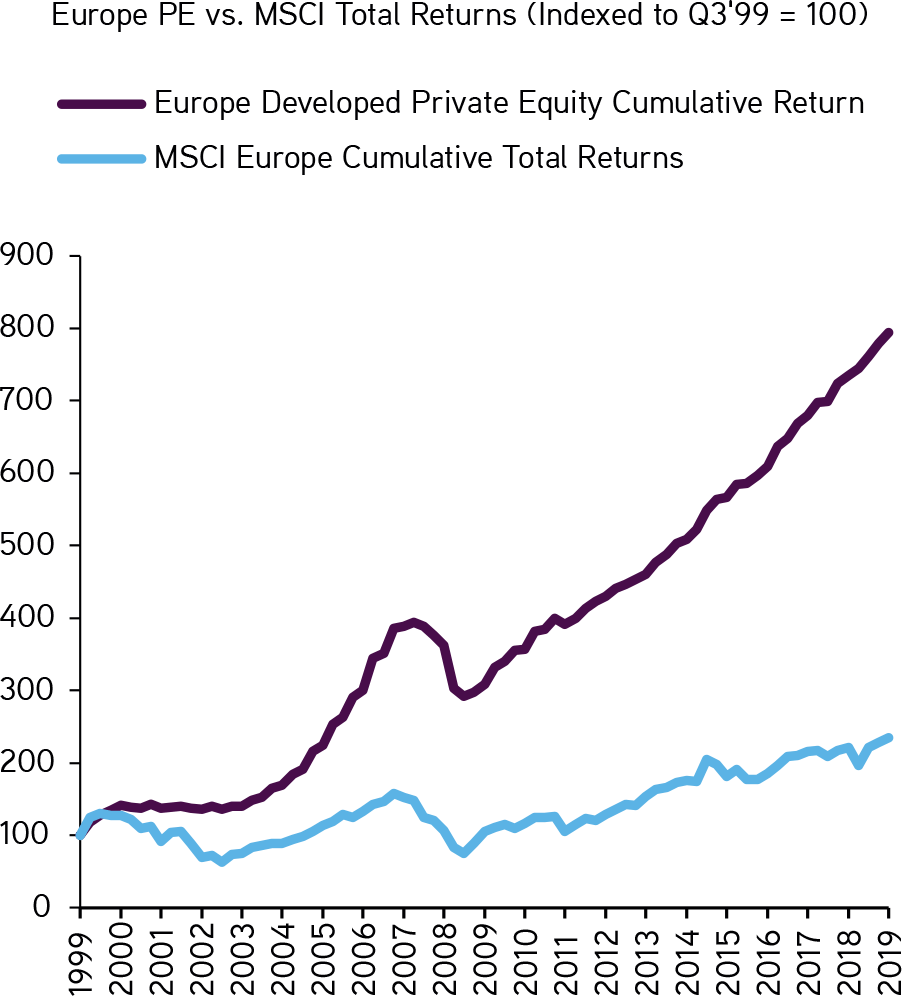
Data as at December 31, 2019. Source: MSCI, Bloomberg.
A similar story holds true for Asia. For example, in Indonesia there are literally no publicly traded Technology companies in the MSCI Indonesia index. Yet, as we show in Exhibit 51, internet and mobile usage statistics in the country are incredibly compelling. For Private Equity and Growth investors, the ability to provide clients’ access to companies with exposure to these mega-trends is a performance differentiator. Meanwhile, the public index in Indonesia is largely dominated by banks and other financial institutions. As such, many investors who think they are gaining exposure to Indonesia’s compelling GDP-per-capita trends are actually not. Importantly, our travels throughout the Asian emerging markets have led us to believe that Indonesia is not an outlier (Exhibit 52); hence we retain our bullish stance that there is the potential for the illiquidity premium in Asia to actually increase, not decrease, during the coming five- to seven-years.
EXHIBIT 50
Indonesia’s Capital Markets Have Zero Exposure to Technology, Despite Huge Economic Growth in This Area…

Data as at May 31, 2020. Source: MSCI.
EXHIBIT 51
…and Why We Favor Private Markets in Many Instances

Data as at March 2020. Source: Cisco.
EXHIBIT 52
Many Public Market Indexes Are Not Allocated to the Rising GDP-Per-Capita Themes That We Champion
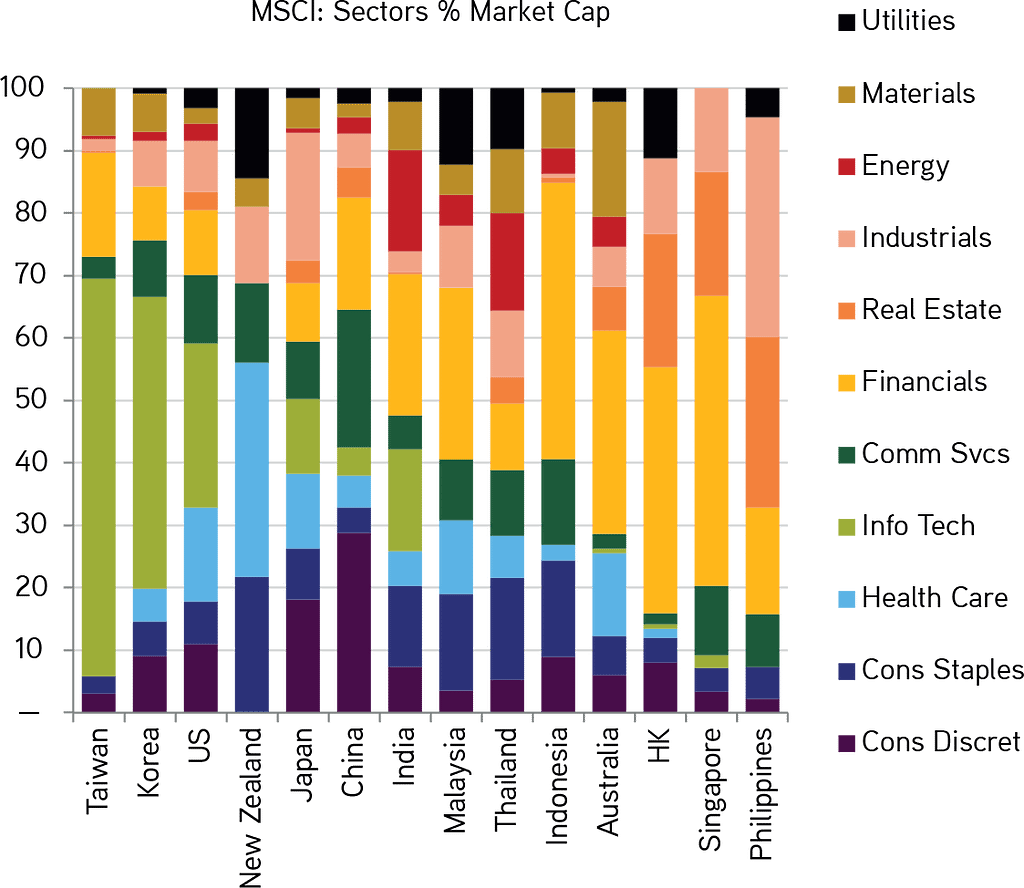
Data as at May 31, 2020. Source: MSCI, Factset.
Within Credit, we remain constructive on Asset-Based Finance in the private markets and Opportunistic Credit in the liquid markets. The former (i.e., Asset-Based Finance) gives investors the ability to generate immediate cash flows backed by hard assets that can appreciate if there is inflation. There is also collateral in the event that the underwriting cycle is more difficult than imagined. On the latter (i.e., Opportunistic Credit), we continue to expect periodic bouts of volatility, and in this environment the opportunity to generate both alpha and beta is quite compelling for adept managers with deep underwriting expertise. Moreover, dislocated credits that occur during periods of risk-off selling create opportunities to enhance portfolio yield in an environment where we think interest rates remain stubbornly low relative to savers’ expectations.
We also believe that many parts of the pure Real Assets universe will prove to be market share gainers over the next five years. In particular, we see Infrastructure as a play on one of our key macro themes: Telecommunications/Data Intensity. One can see the potential for growth in Exhibit 53, as the cloud continues to gain significant momentum. In addition to Telecommunications, there are many other parts of the Infrastructure universe that are ESG-plays, such as water and wind, which we think will garner more interest from investors as well. Finally, given that so many segments of the Infrastructure investment arena have step-ups in pricing — often linked to inflation — in their contracts, we think that they will be even more appealing in the environment that we envision. Indeed, if the money multiplier does ultimately gain momentum, then owning assets with pricing power tied to nominal GDP will be a distinguishing feature.
EXHIBIT 53
Data Centers and Optical Infrastructure Remain Key Areas of Focus Within Infrastructure
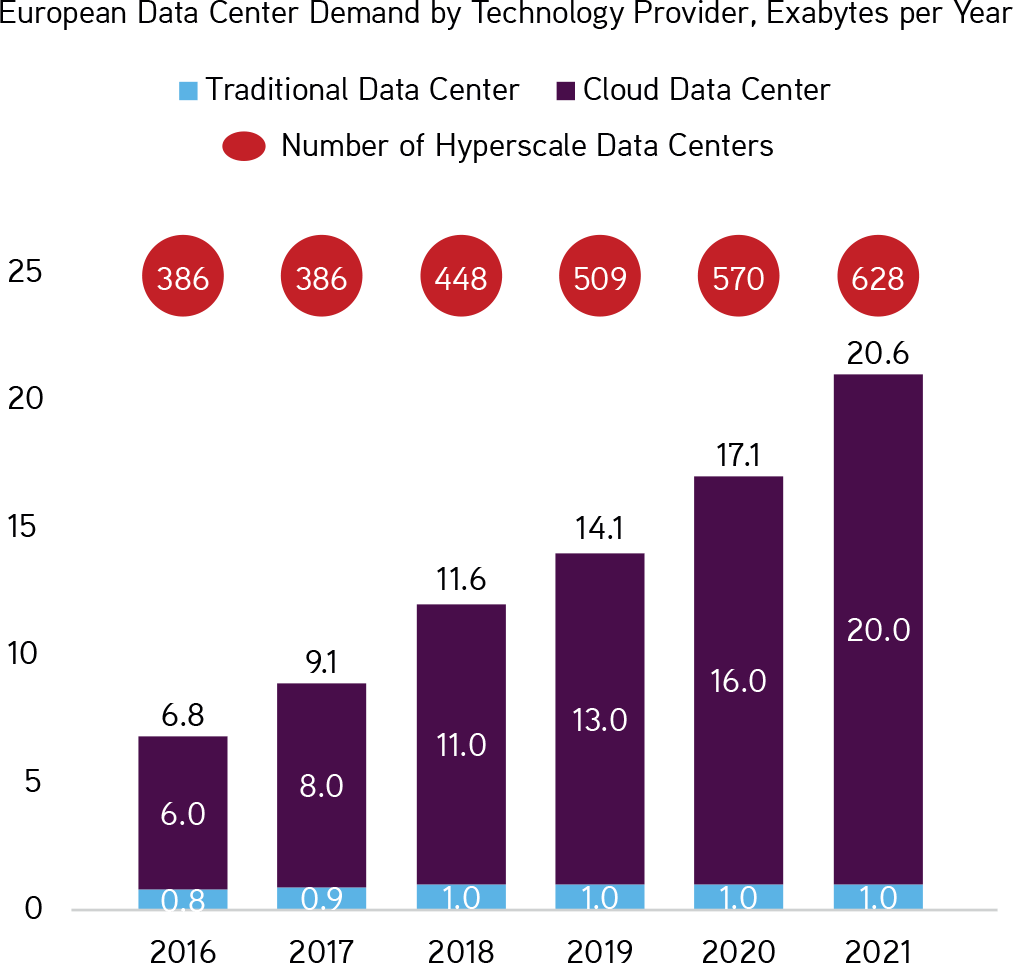
Data as at April 30, 2020. Source: Credit Suisse, JLL, Cushman & Wakefield, CMA Research.
EXHIBIT 54
We Expect Asset-Based Finance Outside of the Banking System to Continue to Grow

Data as at June 30, 2020. Source: Integer Advisors
On the more cautious side of the ledger, we are increasingly of the mindset that unsecured loans will evolve into a problem area in 2021. Our base case for unemployment is still a hefty 7.2% in the fourth quarter of 2021, which likely means more write-offs are coming. Already, there are more than 106 million consumer loans in the U.S. that are seeking some form of forbearance, with total delinquencies reaching 2.47% in 1Q20, compared to 1.99% in 1Q16.
Meanwhile, while the Federal Reserve is backstopping much of the municipal market, our experience is that these securities, which are often viewed as safe havens, do not provide much ballast to the portfolio in the event of a risk-off regime. As such, we see fewer entities, insurance companies and certain high net worth individuals in particular, owning municipals as defensive plays. Finally, there are parts of the office and retail markets that warrant investor attention, given the substantial changes we are seeing in worker/consumer preferences. Moreover, these two industries are facing supply issues at a time when demand is trending below historical levels. Large urban areas are likely to bear the brunt of these trends, we believe.
Given the structural changes to asset allocation we are forecasting, we believe that now is the time for investment committees to do three things. First, they should focus on the tactical to ensure that they have, depending upon their mandate, the liquidity to keep schools going, fund outstanding grants, and pay pensioners and retirees. As a result, meeting frequency should probably increase over the next 12 months, and committee members should target liquidity of around two years of expenses — at a minimum. Second, investment committees should create a strategic planning group that focuses on how asset allocation targets might need to be altered. As we have outlined in this section, the role of bonds is changing at a time when the need for both alpha within and diversification across asset classes is going up, not down. Ultimately, many CIOs and investment committees may need to take more risk in their portfolios, but they will have to do it within the binding constraints of liquidity and volatility limits that make this mandate even more difficult, particularly if we enter a period of heavier government intervention. Third, investment committees should begin to judge returns net of fees and on real terms (i.e., nominal returns less inflation). Given the lower nominal expected returns we are forecasting as well as the potential for inflation to increase over time, understanding the real purchasing power will become much more important in the future, especially given that several more traditional asset classes may actually have a negative real return in the environment we are envisioning.
Section III: CONCLUSION
If we could change ourselves, the tendencies in the world would also change. As a man changes his own nature, so does the attitude of the world change towards him. … We need not wait to see what others do. Mahatma Gandhi
As we head into the back half of the year, we think markets are transitioning towards the reality that COVID cases in the United States are not likely to abate anytime soon. This viewpoint is in great part why we stick to our square root GDP recovery reference versus a more traditional V-shaped one. However, the U.S. is not alone, as we expect continued headwinds in Brazil, Mexico, India, and parts of South East Asia. No doubt, this backdrop means that markets are likely to be volatile through the summer and into the fall. Importantly, though, it is not just coronavirus that is weighing on investor sentiment. Indeed, racial inequality, socioeconomic inequality, and political winds are all likely to influence the direction of both the economy and markets in the second half of 2020 and beyond.
EXHIBIT 55
Racial Inequality and Socioeconomic Inequality Have Reached Record Levels. We Think These Gaps Will Help Set the Agenda for the Presidential Election in the United States

Data as at June 22, 2020. Source: Barron’s, Federal Reserve Board, Survey of Consumer Finances.
EXHIBIT 56
Private Equity Has Traditionally Outperformed Public Equities When Overall Markets Are Starting From Rich Valuations
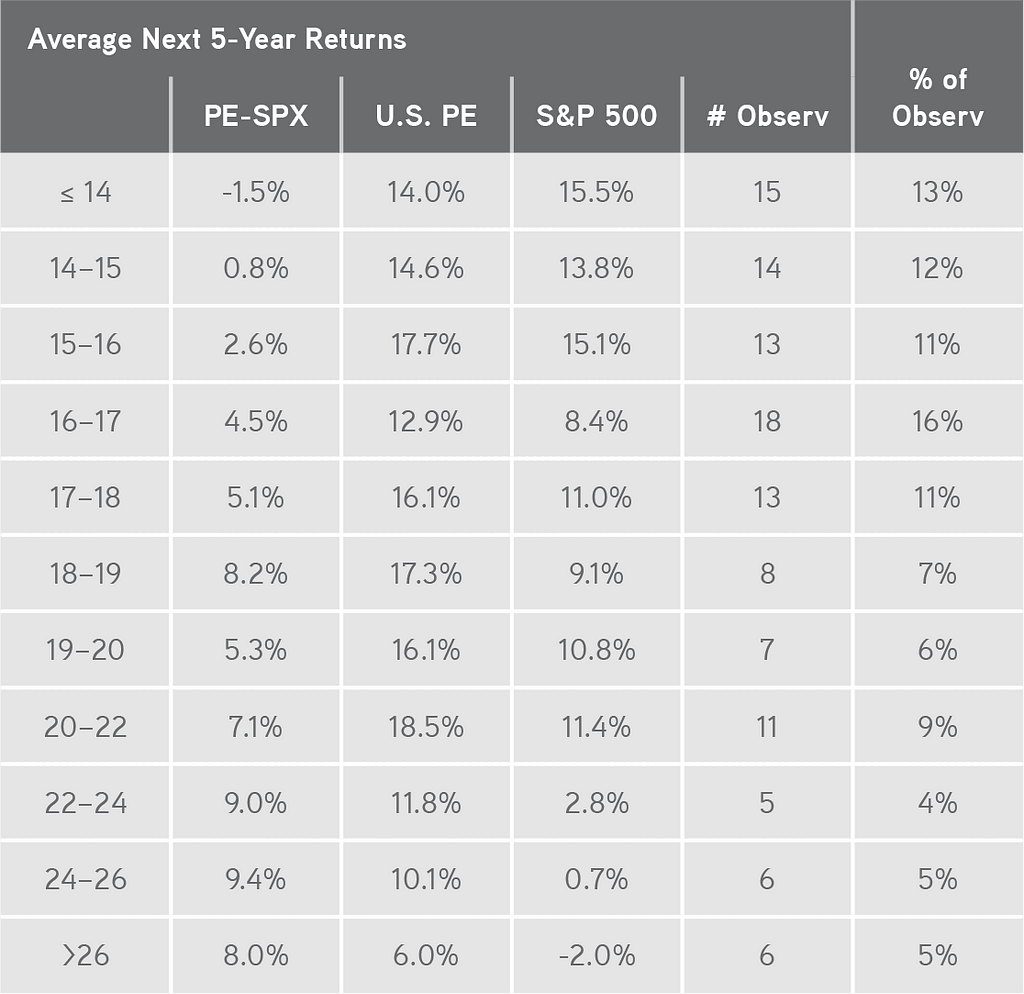
Note: SPX P/E = S&P 500 Last 12 Month Price-to-Earnings ratio. Data as at 1Q86 thru 4Q19. Source: Cambridge Associates, S&P 500, KKR Global Macro & Asset Allocation analysis.
Against this uncertain backdrop, however, there is a record amount of liquidity in the system. Rates are low, financial conditions are favorable, and there is more fiscal and monetary stimulus coming. Remember in the United States, for example, we are only about 50% of the way through the 44% of GDP that is expected to get spent to fight off the effects of the coronavirus.
Maybe more important, though, is that we want to re-emphasize our simple but effective framework for controlling what we can control. Specifically, we encourage all investors to 1) focus on getting the themes right; 2) target opportunities for value creation; and 3) embrace capital structures that allow flexibility. Throughout KKR’s 44-year history, these three pillars of investment advice have served the organization incredibly well.
Beyond this three-pronged approach to portfolio construction, we think macro investors and asset allocators should take a step back and reflect on where we are headed. In our view, more assets should be allocated to collateral-based Real Assets, including Infrastructure and select parts of Real Estate (housing, logistics, warehouses, etc.). Separately, we also value the illiquidity premium more now than pre-coronavirus, and in areas such as Asian and European Private Equity, we would swap some capital out of Public Equities into Private Equity, especially for allocators that are not near-term liquidity constrained. We also believe that Opportunistic Liquid Credit and Asset-Based Finance could all outperform in the environment we are envisioning.
EXHIBIT 57
Unlike Prior Downturns, COVID-19 Has Accelerated Existing Relative Growth Trends — Not Reversed Them. In Our View, Technology, Software in Particular, Will Be a Global Beneficiary
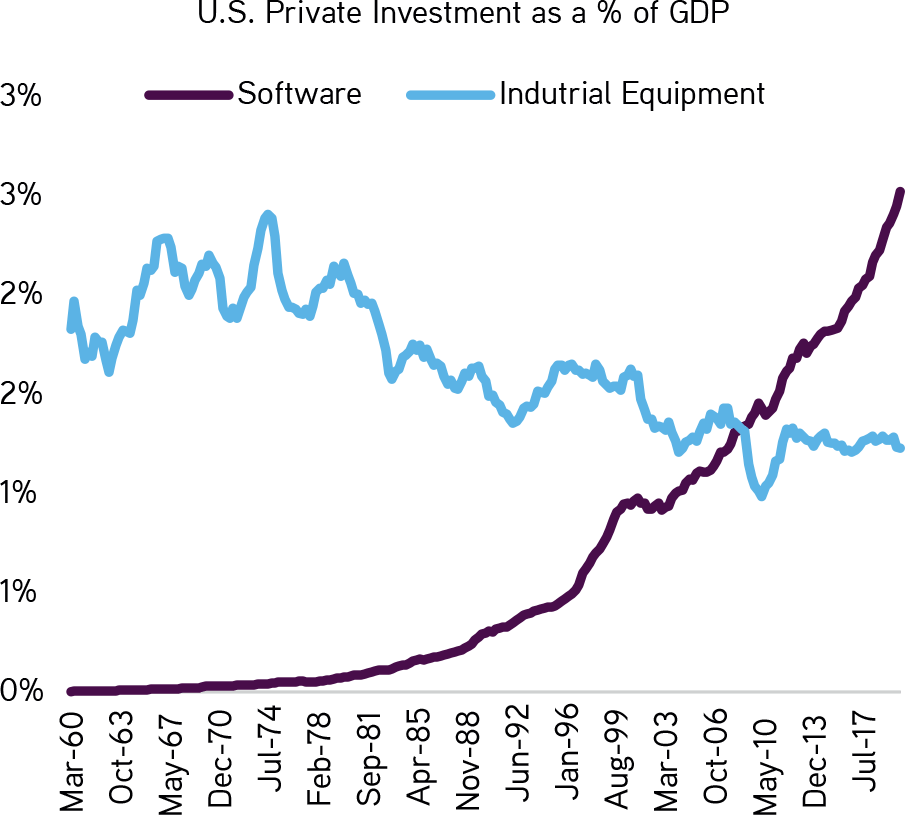
Data as at March 31, 2020. Source: Goldman Sachs.
In terms of what we will be watching (and where we see the most risk to our target portfolio), our macro outlook is dependent on rates staying low through the end of at least 2022. Indeed, it drives our preference for ‘core’ cash flow compounders in Equities, Asset-Based Finance, Real Assets, and the Yearn for Yield. So, as we detailed in this Insights report, markets cannot afford to have the money multiplier accelerate way beyond our current expectations. Were it to do so, it would affect the valuation of all financial assets materially, further complicating what is already a difficult macroeconomic landscape to navigate.